
Crypto Today: Bitcoin shows resilience as BTC exchange reserves hit lowest level in 7 years
- Bitcoin recovery is limited between support at around $103,000 and resistance at approximately $106,800.
- The number of Bitcoins on exchanges continues to drop, reaching the lowest level since August 2018.
- Ethereum extends gains underpinned by increasing spot ETF inflows.
The cryptocurrency market is displaying a lukewarm recovery across the board, with Bitcoin's (BTC) price hovering at around $105,455 at the time of writing on Wednesday. At the same time, the largest smart contracts token, Ethereum (ETH), continues to consolidate, with a bullish bias backed by persistent spot Exchange Traded Funds (ETFs) inflows.
Market overview: Bitcoin's recovery stalls as altcoins consolidate
Bitcoin is up over 2% from its recent lower low of around $103,068 set on Saturday, although its recovery stint on Tuesday stalled at approximately $106,800. This lock-step uptick comes amid declining BTC futures Open Interest (OI), which fell to $70.89 billion from $80.16 billion recorded on May 23.
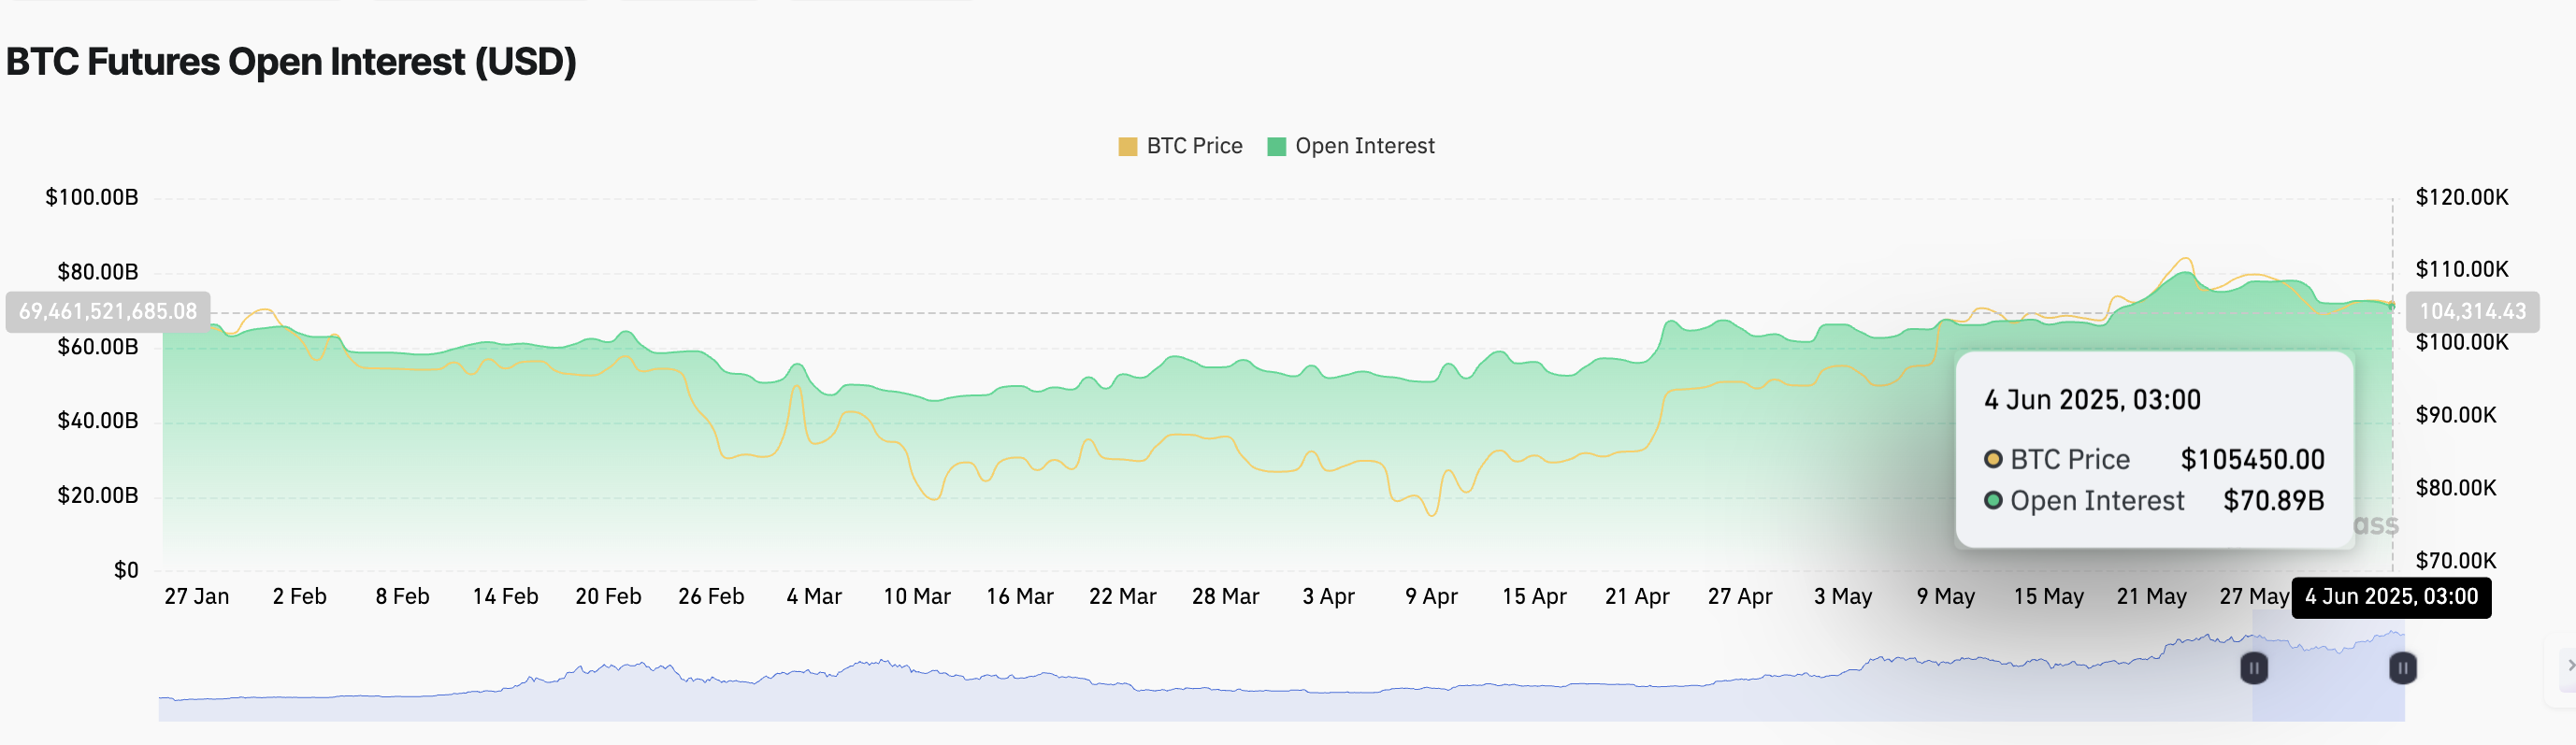
Bitcoin futures Open Interest | Source: CoinGlass
A subsequent decrease in trading volume to $77.40 billion from $203.21 billion implies dwindling interest from traders in BTC. This shows that market participation is declining, signaling indecision.
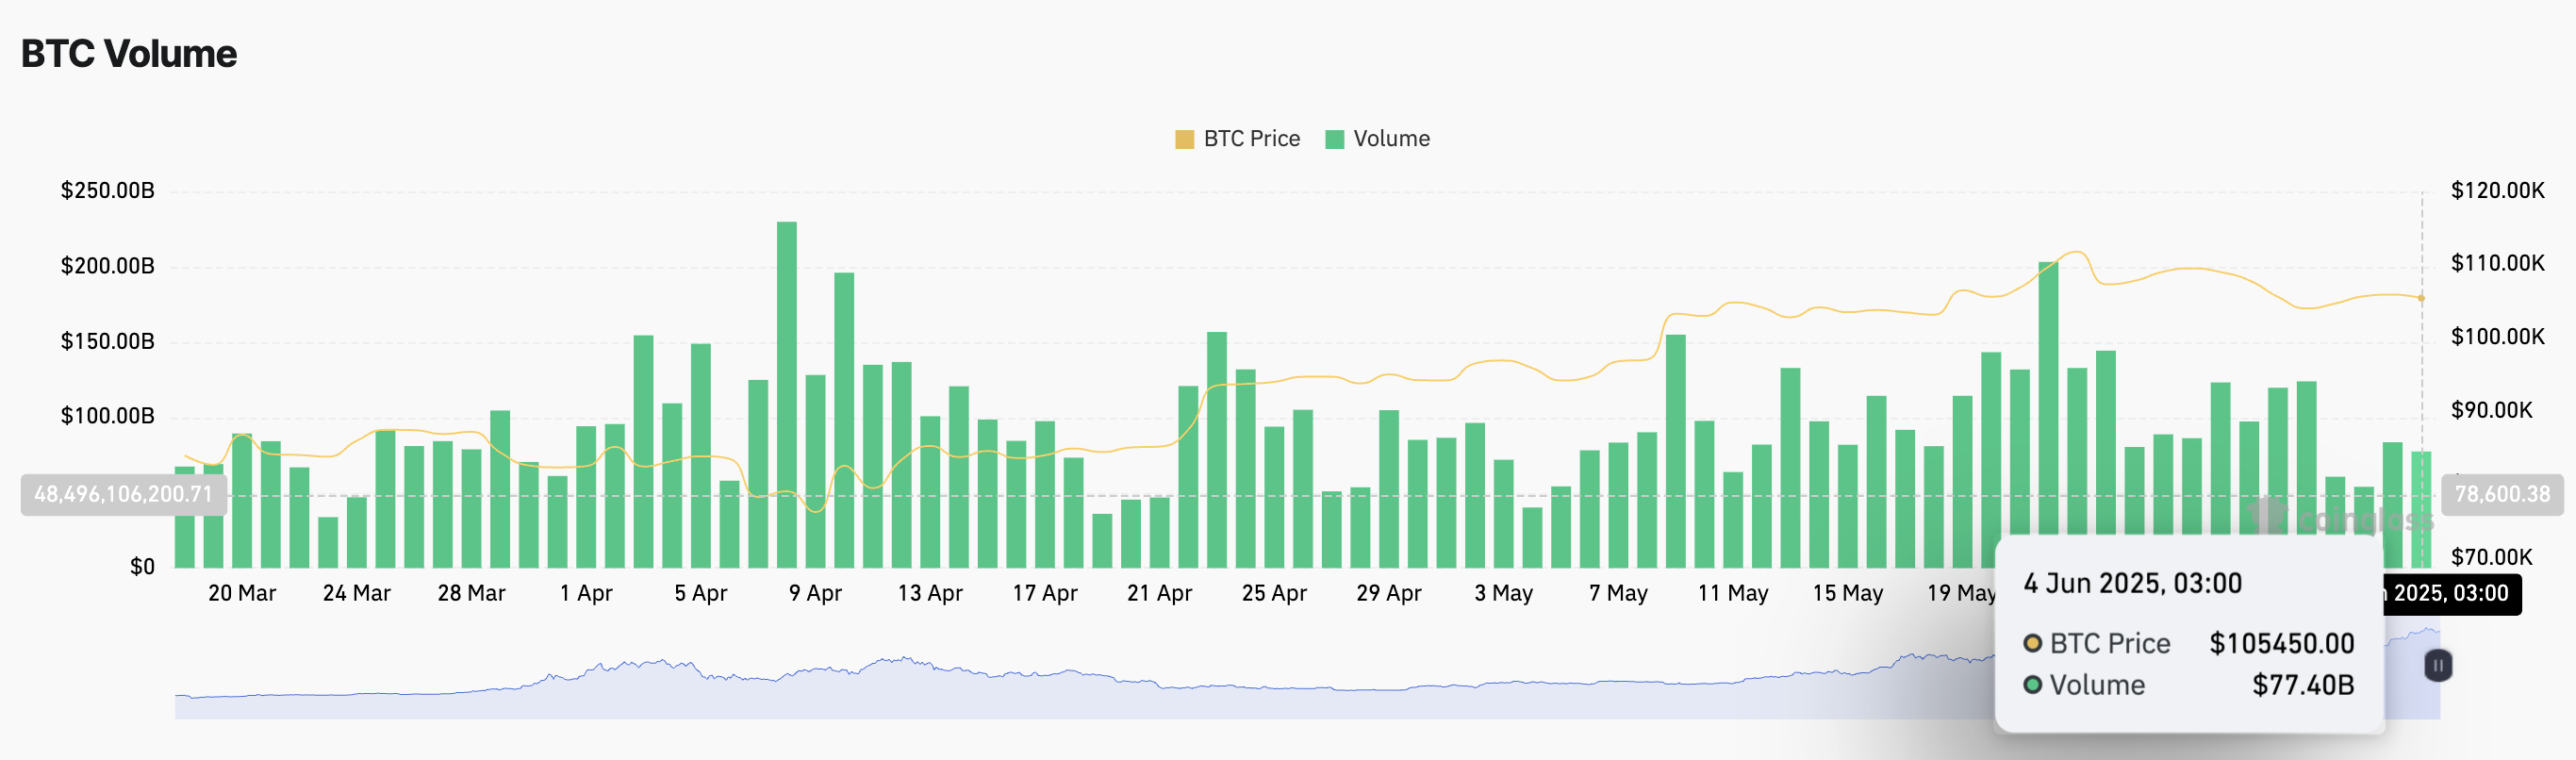
Bitcoin futures trading volume | Source: CoinGlass
Data spotlight: Bitcoin exchange reserves dropping as ETH spot ETF inflows surge
Bitcoin exchange reserves, which refer to the number of BTC available on exchanges, have continued to decline at an even more rapid pace in recent weeks. According to the CryptoQuant on-chain data chart shown below, exchange reserves currently stand at slightly above 2.38 million BTC, representing a 13.5% drop from 2.75 million BTC on January 1, 2024, and a 23.5% decrease from 3.11 million BTC a year before.
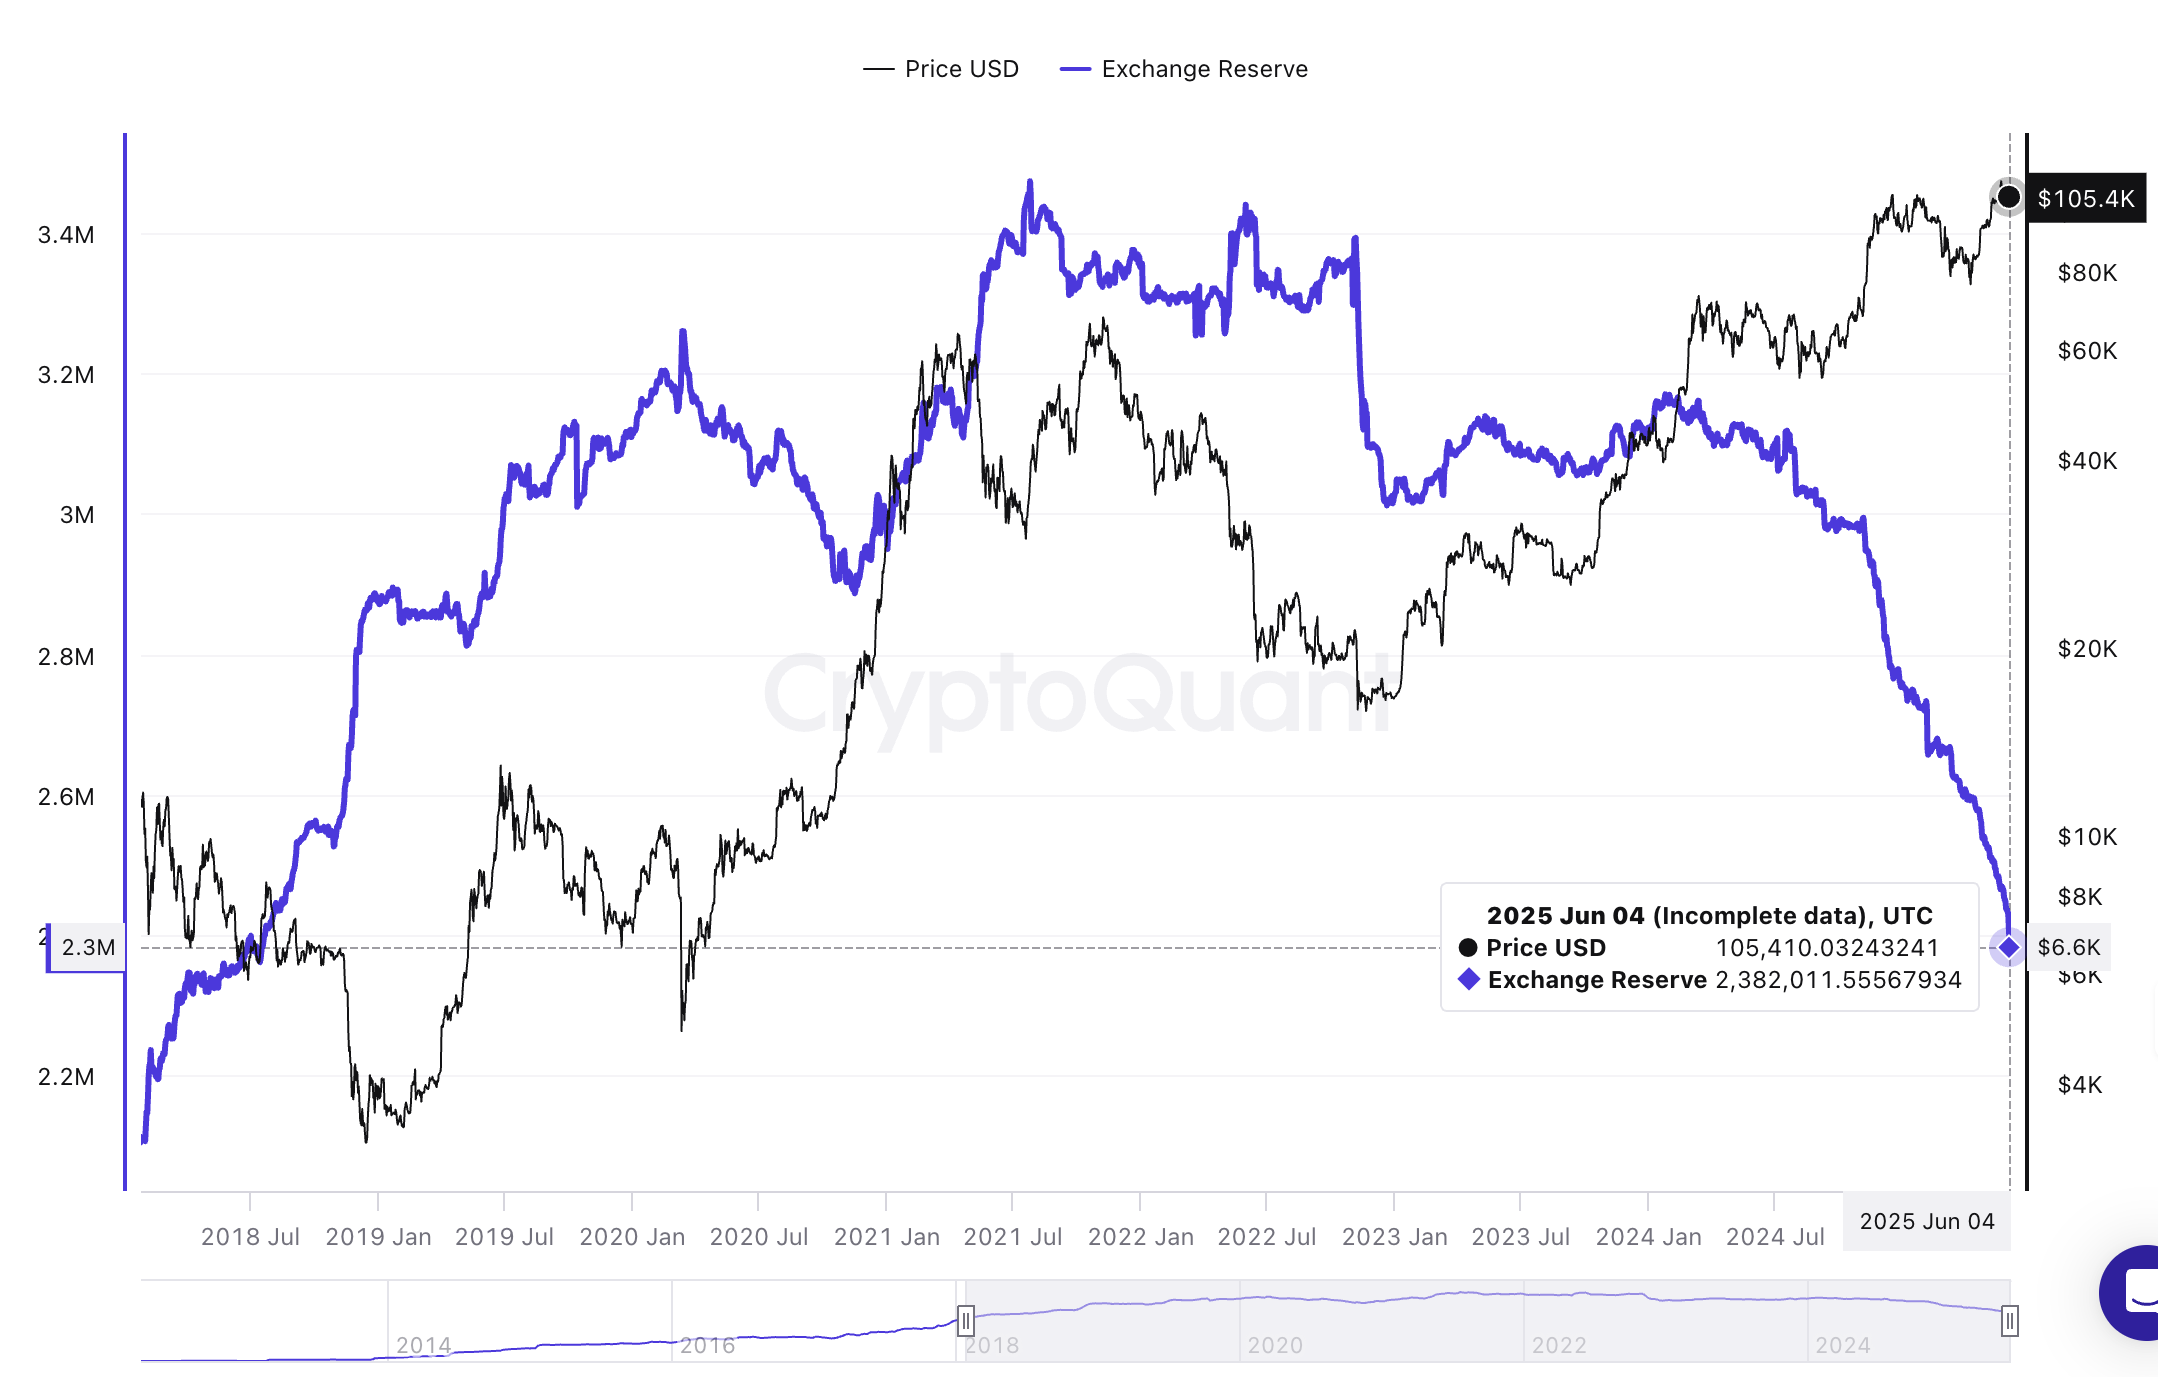
Bitcoin exchange reserves | Source: CryptoQuant
Falling exchange reserves suggest that fewer coins are held on exchanges, which translates to reduced potential selling pressure. When investors aggressively move BTC to private wallets for long-term storage, it indicates that they are confident in the asset's future and the ecosystem's prospects. This could signal bullish sentiment and even trigger a larger price increase, especially if demand surges.
On the other hand, Ethereum spot ETFs recorded the highest inflow of $109 million in seven days on Tuesday, marking the 12th consecutive day of inflows. According to SoSoValue data, spot ETFs operating in the United States (US) are currently valued at $3.23 billion. BlackRock's ETHA was the best-performing product, with $77 million in inflows, followed by Fidelity's FETH, with approximately $21 million, while Grayscale's ETH took third position with around $8.4 million in inflow volume.
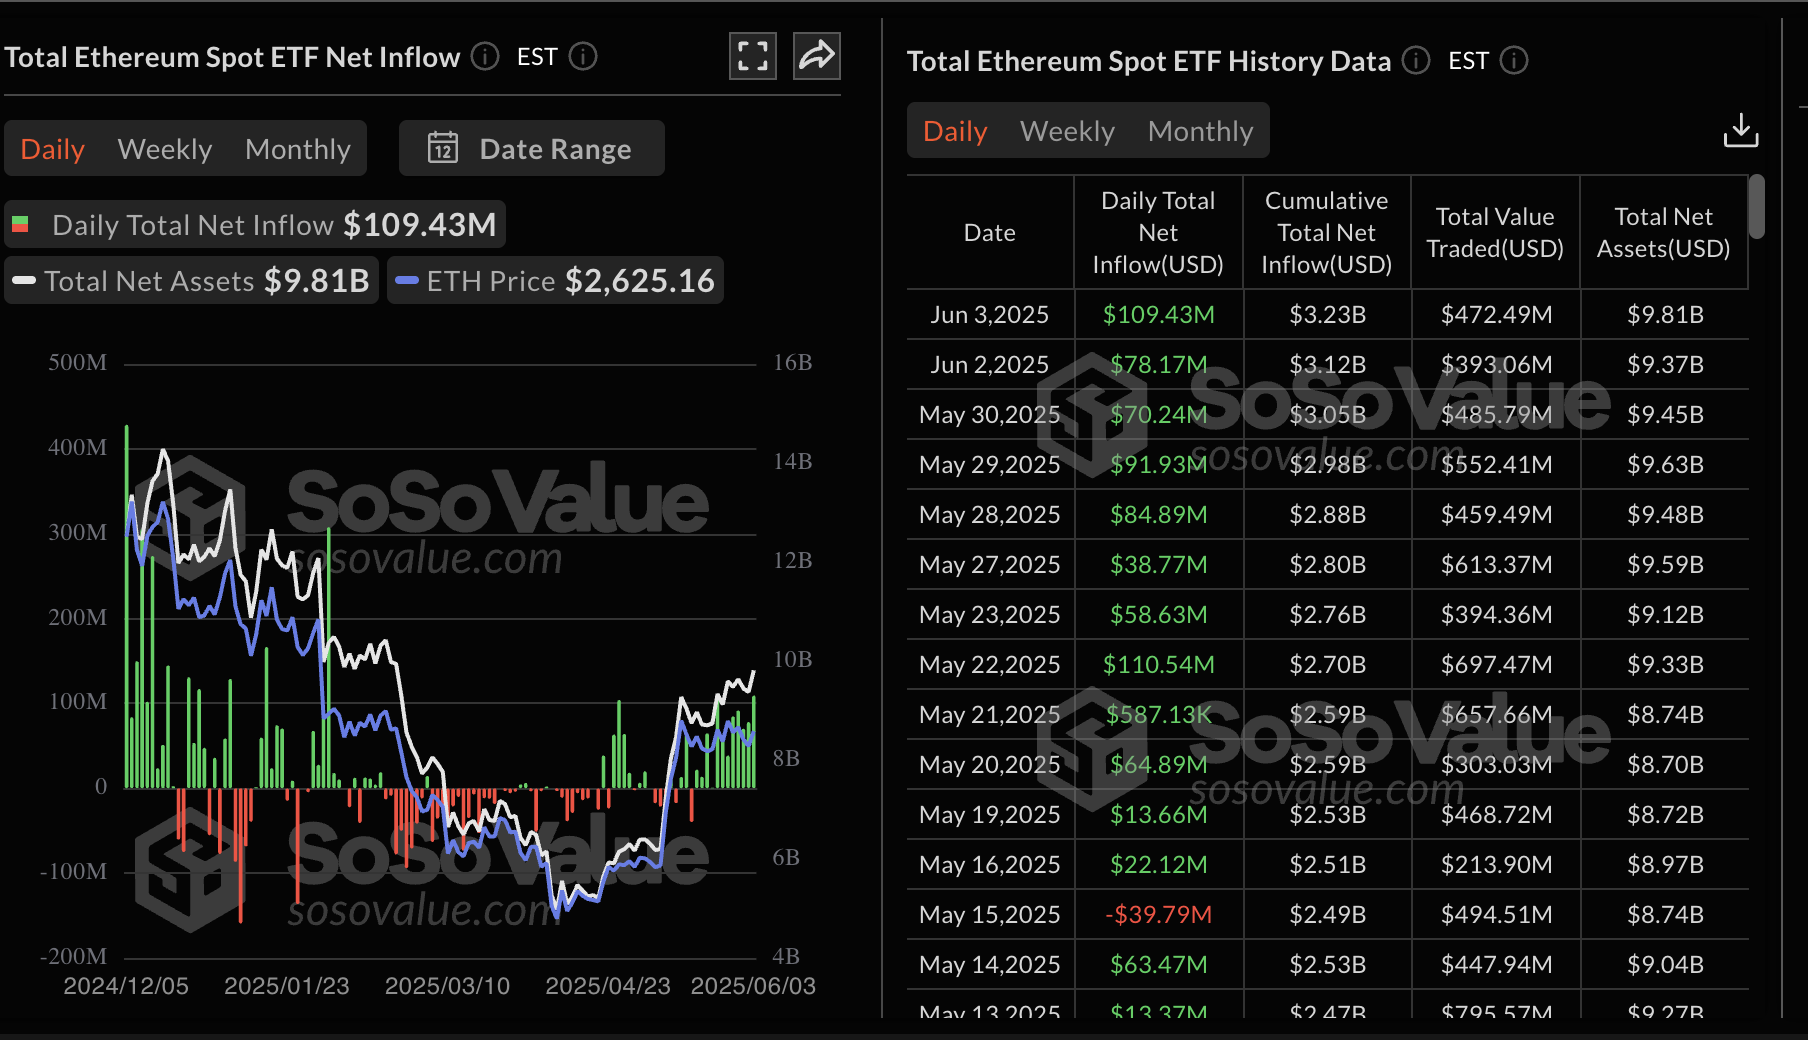
Ethereum spot ETF stats | Source: Tradingview
Chart of the day: Bitcoin recovery subdued by low volume
Bitcoin's recovery toward the critical resistance at $110,000 has remained elusive since the drop to $103,068 last week. An attempt to push past the hurdle lost steam at around $106,800 on Tuesday, culminating in a sharp but brief drop to $105,115 — an area that acts as immediate support.
A break above the 4-hour 50-period Exponential Moving Average (EMA) at around $105,856 could pave the way for a stronger uptrend. The Moving Average Convergence Divergence (MACD) indicator reinforces the bullish outlook by sustaining a buy signal since Sunday.
The path with the least resistance could stay upwards, especially with the Relative Strength Index (RSI) rising above the 50 midline.
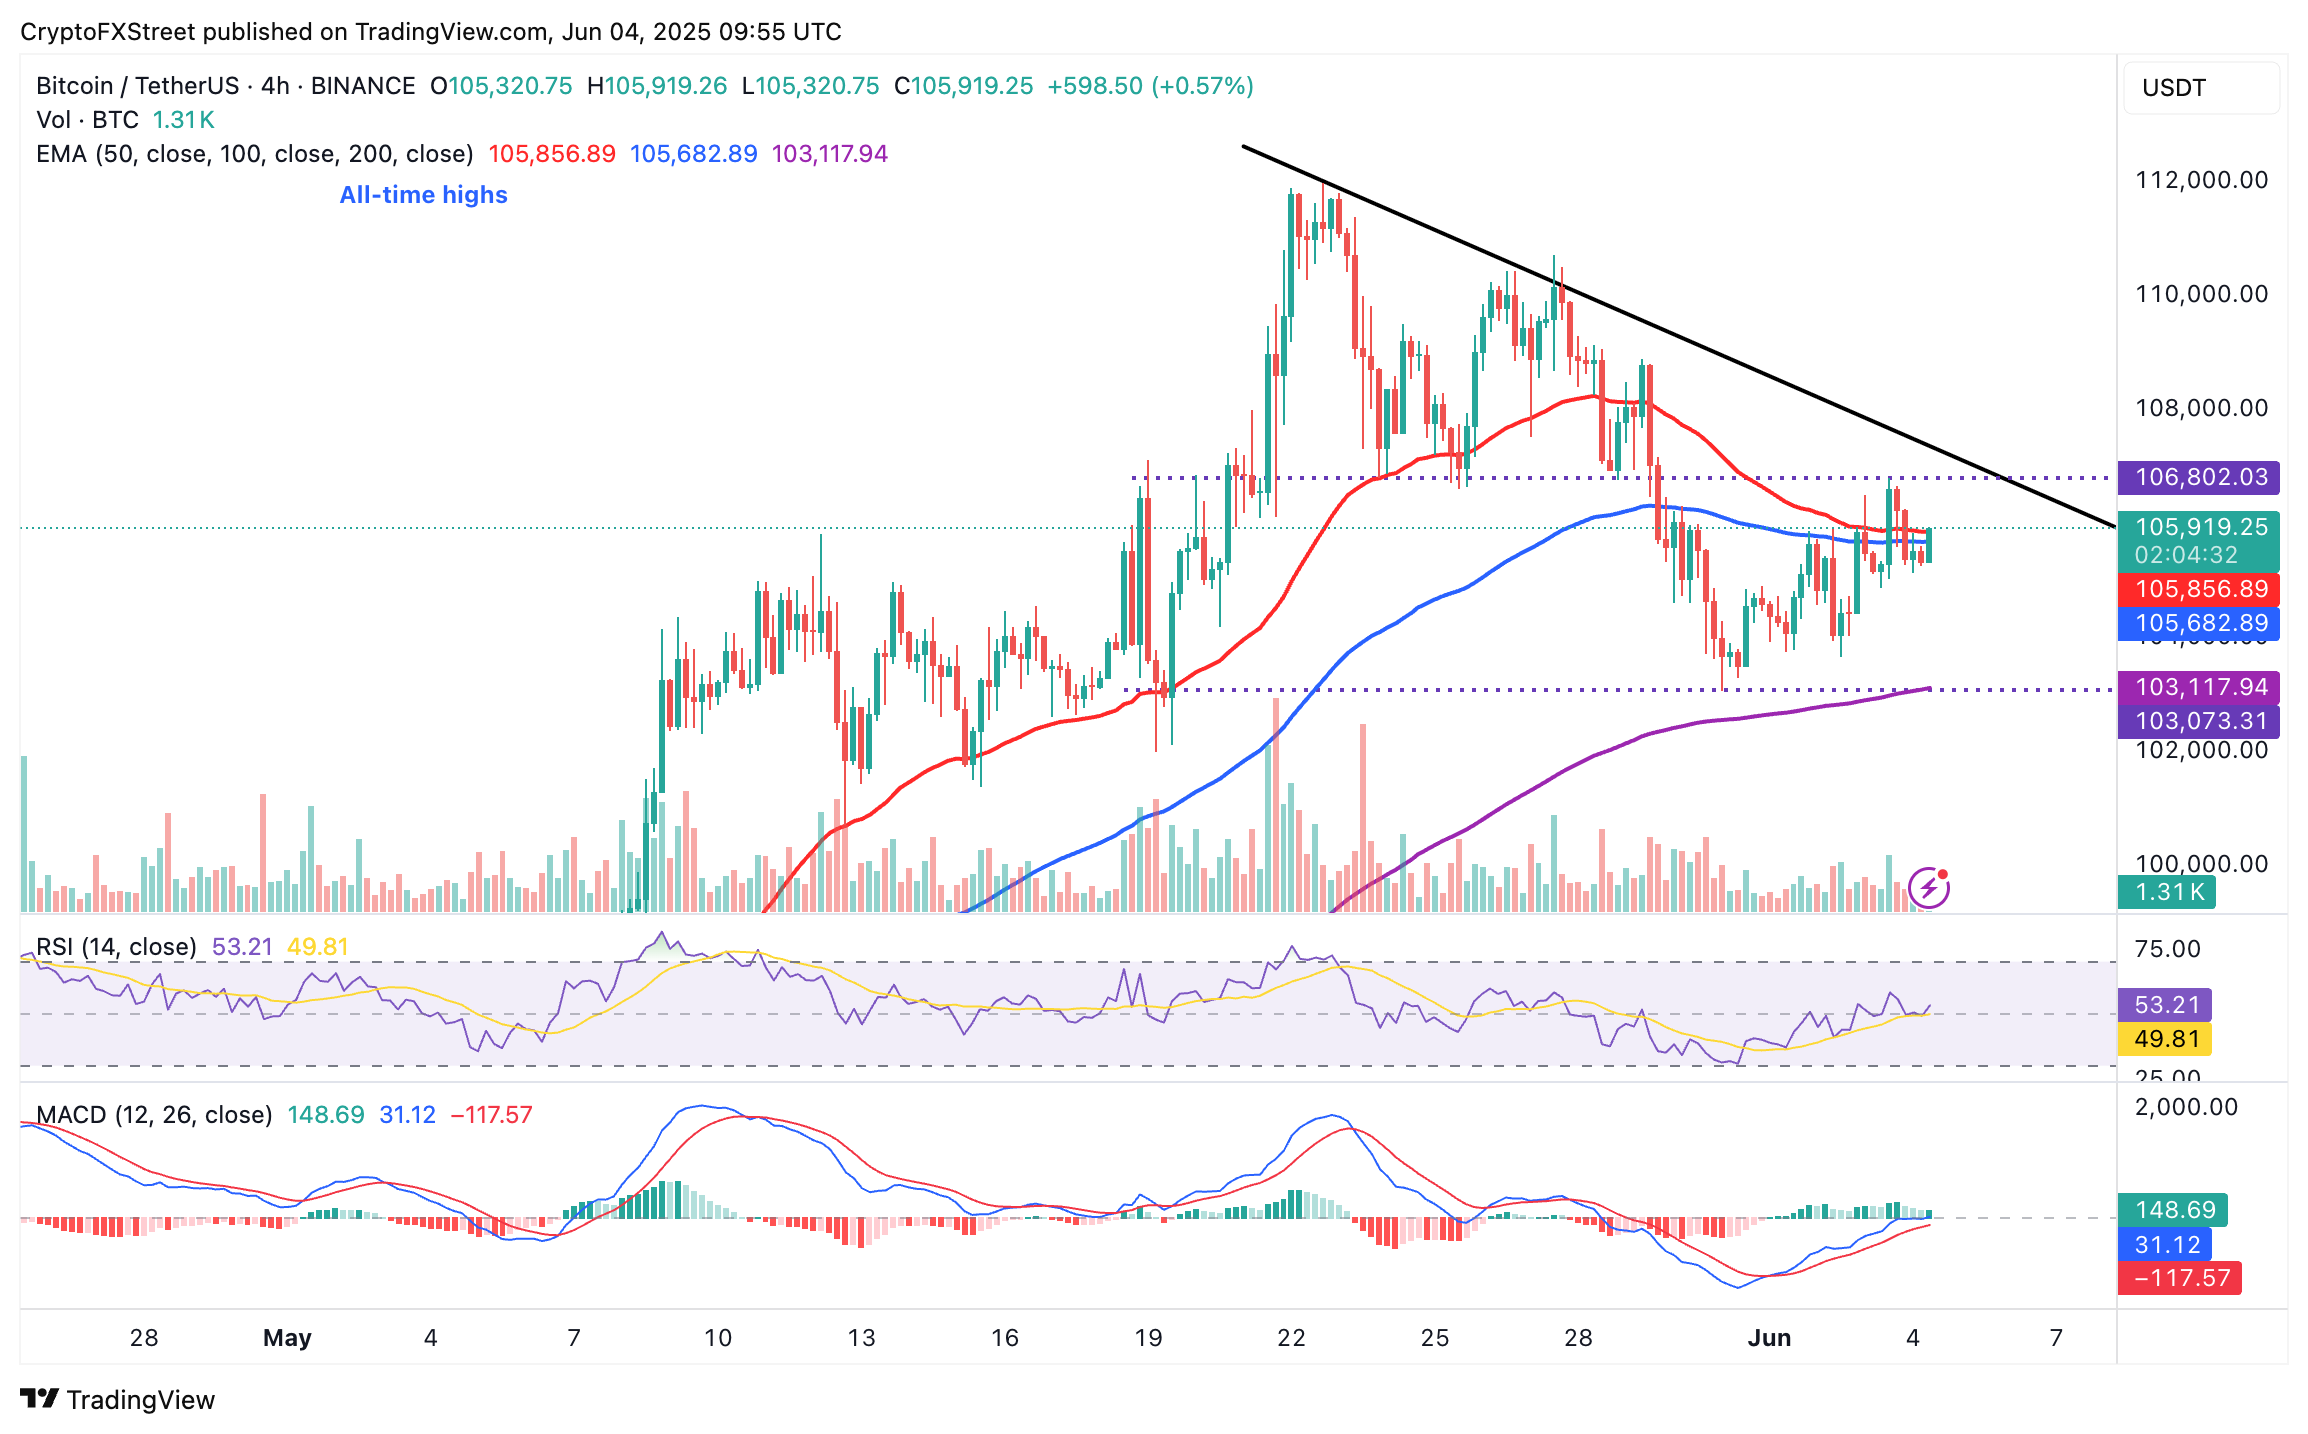
BTC/USDT 4-hour chart
Despite the short-term bullish outlook, a K33 Research market update cautions that low trading volume in spot and futures markets could delay the move to fresh all-time highs.
"Bitcoin climbed to new all-time highs in May in a far quieter ATH climate than normal. Trading volumes have been soft, futures premiums have been likewise, and crypto apps are miles away from topping the leaderboards in app stores," the K33 Research report states.
On the other hand, Ethereum's price remains steady above support at $2,600 while broadly consolidating below resistance near $2,800. The 50-period EMA holds as support at around $2,579.
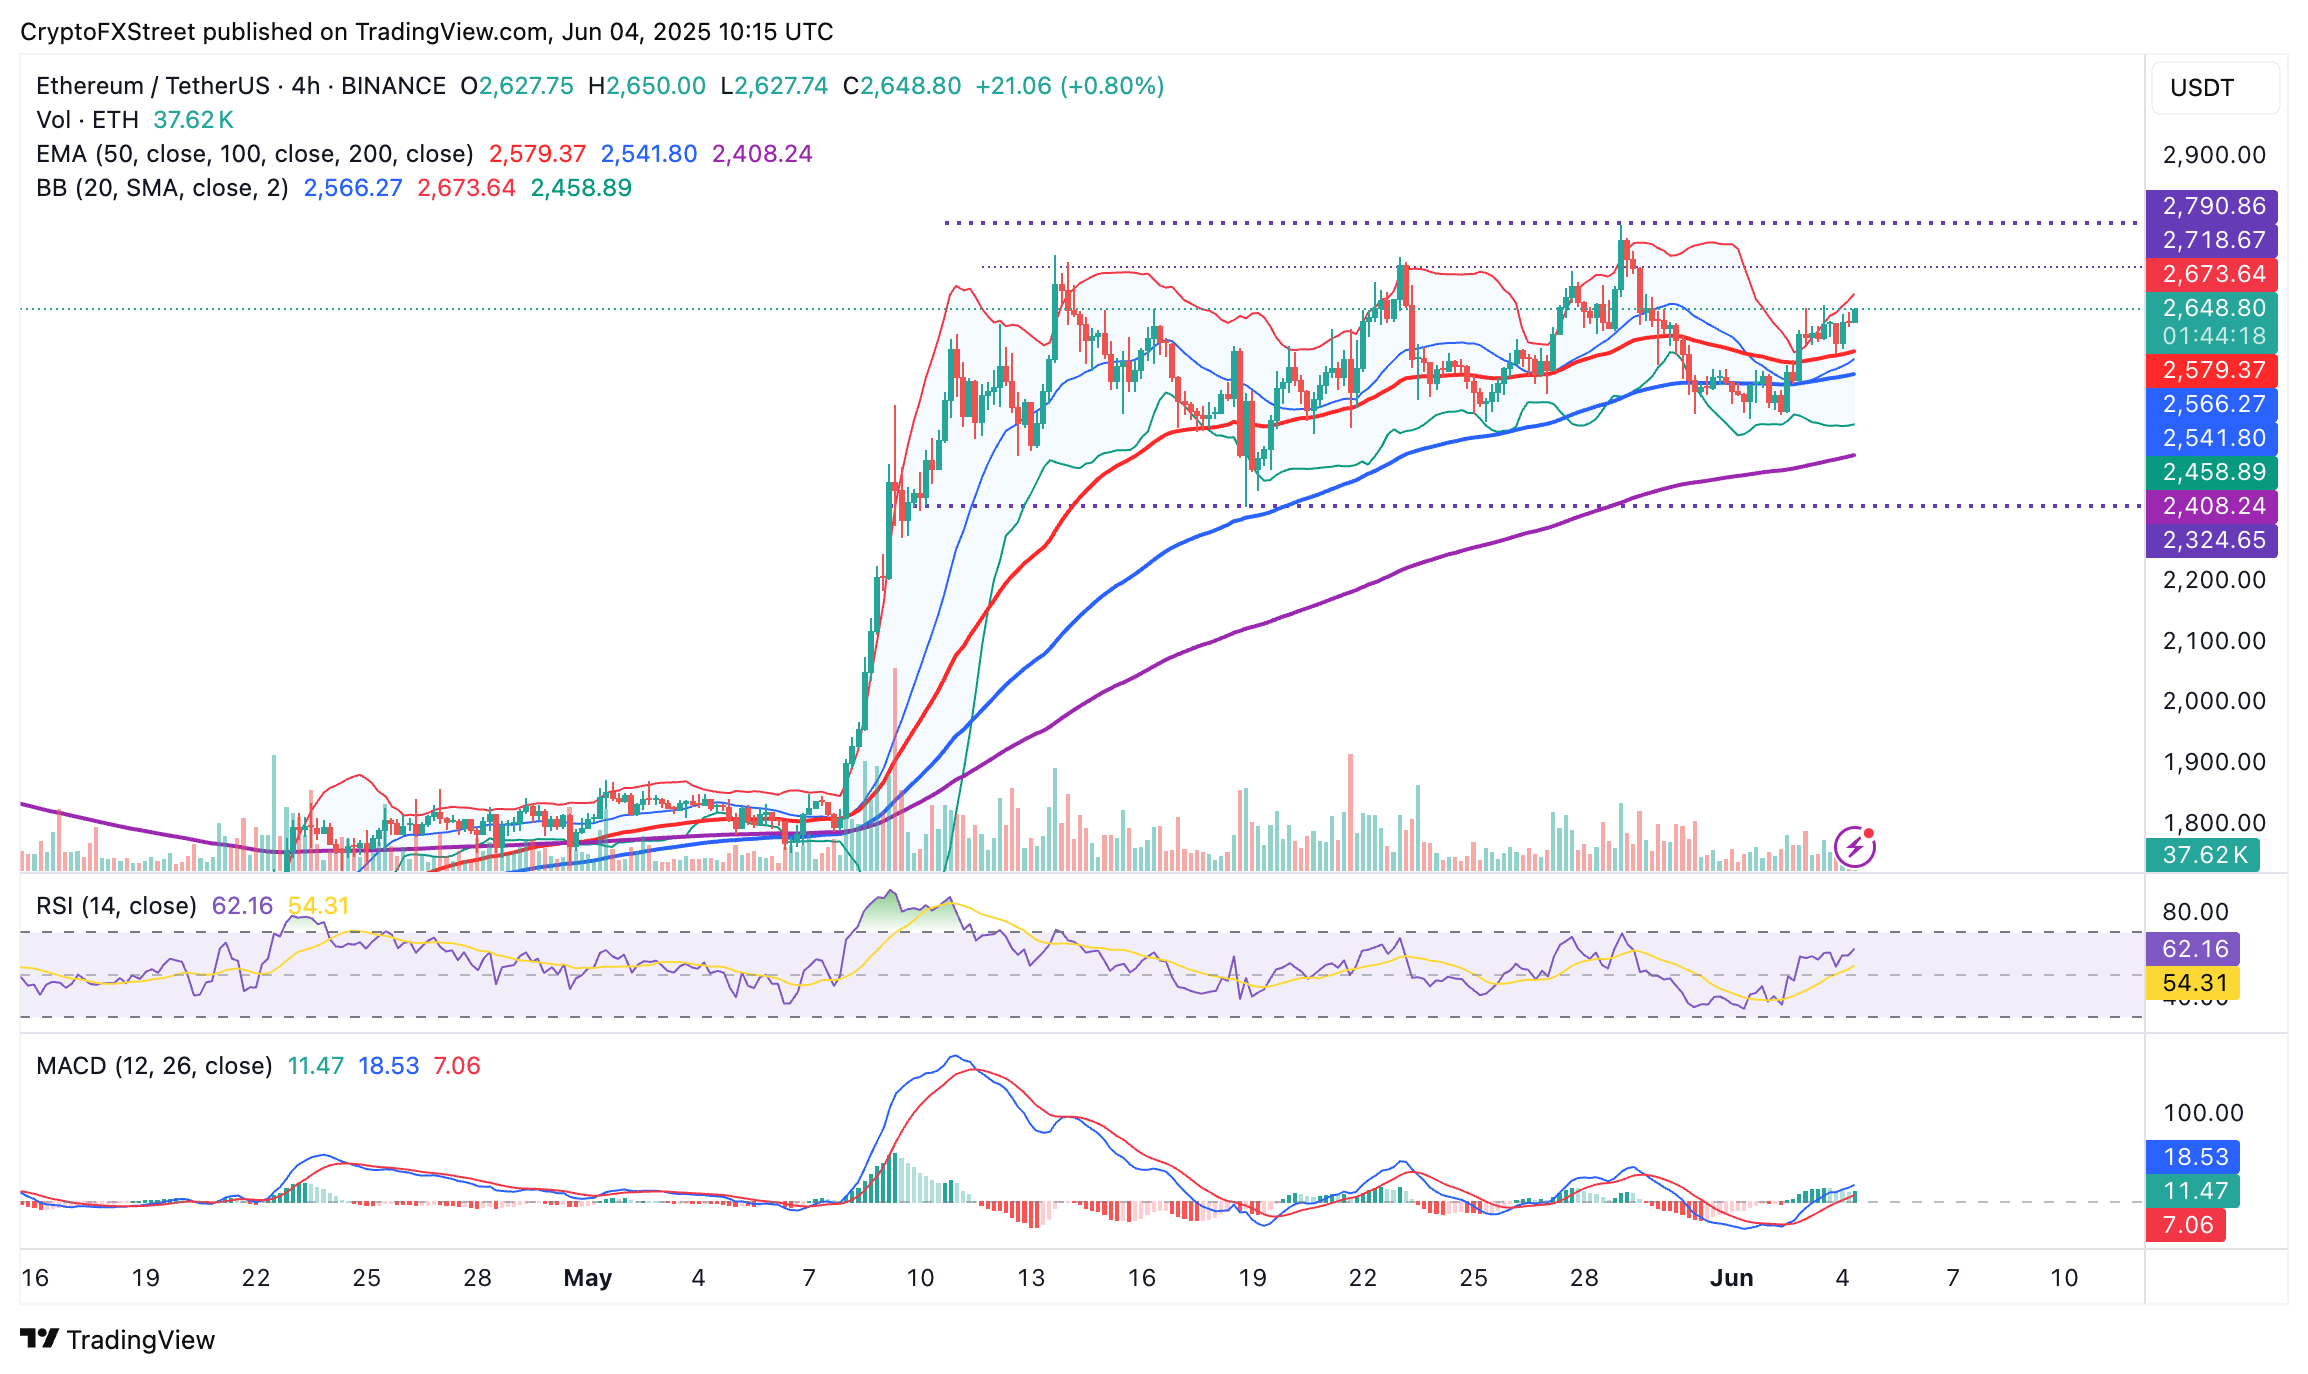
ETH/UDSD 4-hour chart
Based on the MACD indicator's structure above the zero line (0.00), the buy signal and the green histogram bars indicate that the path of least resistance is firmly upward. The RSI reinforces the bullish momentum at 62 as it approaches overbought territory. Should ETH break above the hurdle at $2,800, traders would shift their attention to the area at $3,000, marking a 13% increase from the current price of $2,648.
Cryptocurrency metrics FAQs
The developer or creator of each cryptocurrency decides on the total number of tokens that can be minted or issued. Only a certain number of these assets can be minted by mining, staking or other mechanisms. This is defined by the algorithm of the underlying blockchain technology. On the other hand, circulating supply can also be decreased via actions such as burning tokens, or mistakenly sending assets to addresses of other incompatible blockchains.
Market capitalization is the result of multiplying the circulating supply of a certain asset by the asset’s current market value.
Trading volume refers to the total number of tokens for a specific asset that has been transacted or exchanged between buyers and sellers within set trading hours, for example, 24 hours. It is used to gauge market sentiment, this metric combines all volumes on centralized exchanges and decentralized exchanges. Increasing trading volume often denotes the demand for a certain asset as more people are buying and selling the cryptocurrency.
Funding rates are a concept designed to encourage traders to take positions and ensure perpetual contract prices match spot markets. It defines a mechanism by exchanges to ensure that future prices and index prices periodic payments regularly converge. When the funding rate is positive, the price of the perpetual contract is higher than the mark price. This means traders who are bullish and have opened long positions pay traders who are in short positions. On the other hand, a negative funding rate means perpetual prices are below the mark price, and hence traders with short positions pay traders who have opened long positions.
Recommended Articles


