Monero Price Forecast: XMR declines as on-chain metrics signal overheating and renewed selling pressure

Source Fxstreet
  • Monero price fell by 8% on Wednesday, following an 11% decline over the last two days.
  • On-chain data paint a bearish picture as XMR Spot CVD shows sell-side dominance and retail activity overheating.
  • The technical outlook suggests a continuation of the correction targeting the $302.4 mark.

Monero (XMR) fell by more than 8% on Wednesday, following a sharp decline over the last two days. On-chain data supports the bearish thesis, as XMR’s Spot CVD indicates sell-side dominance and overheating conditions among retail investors. The technical outlook suggests weakness and continuation of correction.

Monero’s on-chain metrics show a bearish bias 

CryptoQuant data, as shown in the graph below, highlights selling pressure on Monero. The Taker CVD (Cumulative Volume Delta) for XMR has been red and has increased since early May. This indicator measures the cumulative difference between market buy and sell volumes over three months. When 90-day CVD is positive (green) and increasing, it suggests the Taker Buy Dominant Phase, while a negative (red) and decreasing value indicates the Taker Sell Dominant Phase.

XMR Spot Taker CVD chart. Source: CryptoQuant

XMR Spot Taker CVD chart. Source: CryptoQuant

Another bearish outlook is CryptoQuant’s Futures Retail Activity Through Trading Frequency Surge data, which shows the overheating conditions. This metric measures the activity level of retail investors in XMR based on their trading frequency. High retail activity indicates that retail traders are flooding into the market, often chasing price movements, which can signal local tops.

XMR Futures Retail Activity Through Trading Frequency Surge Source: CryptoQuant

XMR Futures Retail Activity Through Trading Frequency Surge Source: CryptoQuant

XMR summary chart. Source: CryptoQuant

XMR summary chart. Source: CryptoQuant

Monero Price Forecast: XMR bears take control 

Monero price has rallied by more than 55% since early May. A correction generally follows after such a massive rally. At the start of this week on Monday, XMR faced a pullback of more than 11% until the next day. At the time of writing on Wednesday, it continues to trade down by 8% at around $338.73

If XMR continues its correction, it could extend the decline to retest its 50% price retracement at $303.61, drawn from the April low of $185.93 to the May high of $420.08.

The Relative Strength Index (RSI) on the daily chart reads 49, sharply rejecting its overbought level of 70, and slips below its neutral value of 50, indicating strong bearish momentum. The Moving Average Convergence Divergence (MACD) also showed a bearish crossover, further supporting the bearish conditions.
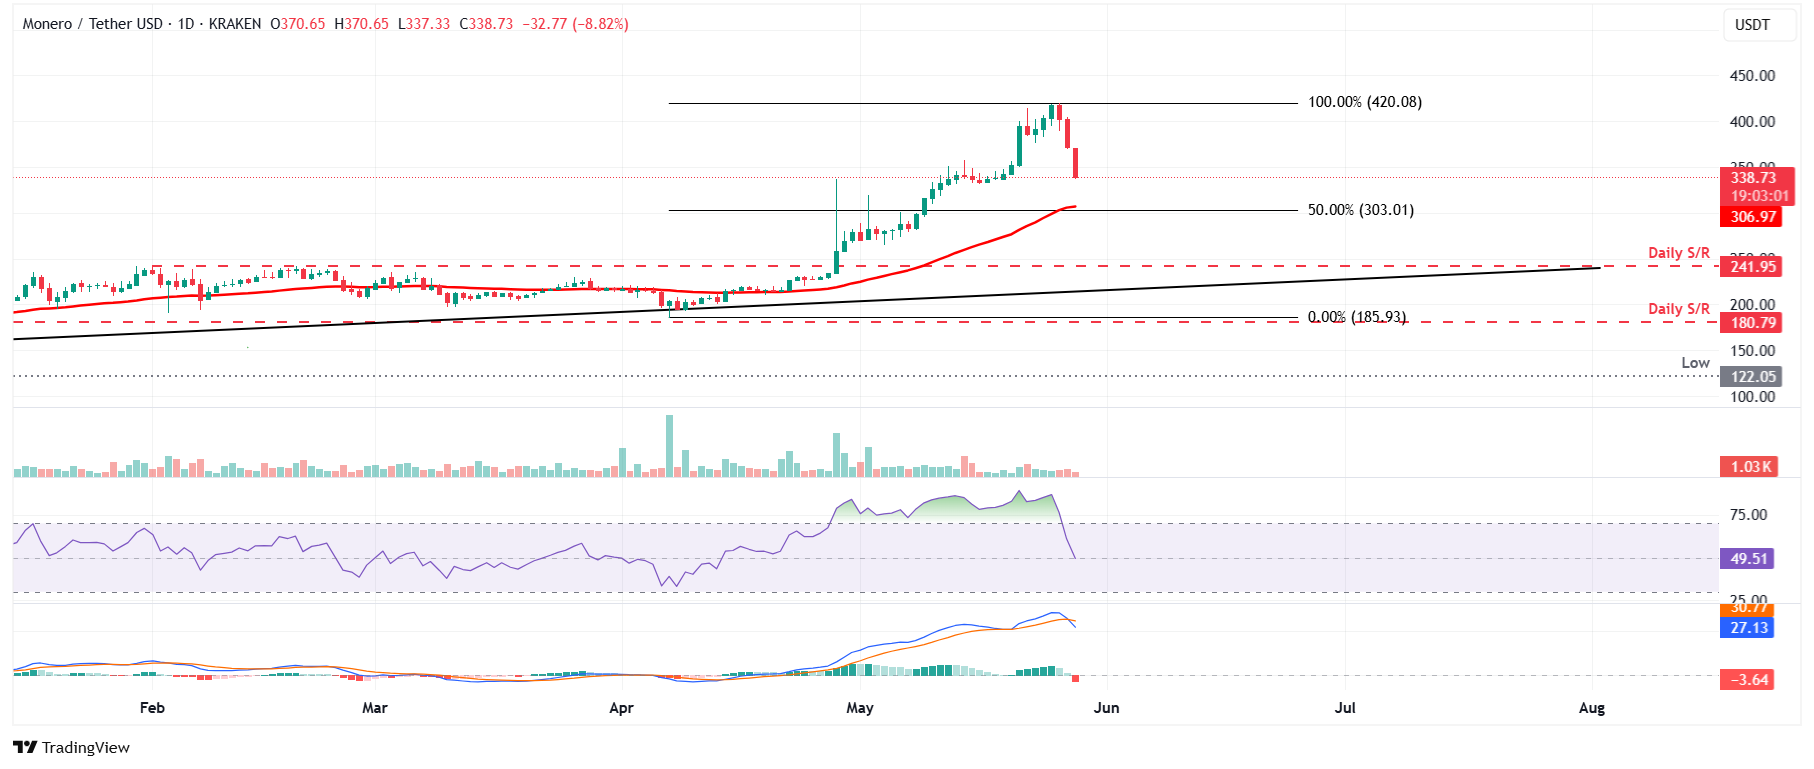
XMR/USDT daily chart

XMR/USDT daily chart

However, if XMR recovers, it could extend the recovery to retest its recent high of $420.

Disclaimer: For information purposes only. Past performance is not indicative of future results.
placeholder
Gold Price Forecast: XAU/USD retreats further from all-time highs of $3,245 Gold price is back in the red early Monday, snapping a three-day record rally to lifetime highs of $3,245 set on Friday.    
Author  FXStreet
4 Month 14 Day Mon
Gold price is back in the red early Monday, snapping a three-day record rally to lifetime highs of $3,245 set on Friday.    
placeholder
Bitcoin Must Clear This Critical Cost Basis Level For Continued Upside, Analyst SaysIn a recent CryptoQuant Quicktake post, contributor Crazzyblockk highlighted key Bitcoin (BTC) cost basis zones that the leading cryptocurrency must clear – or avoid breaking below – to
Author  NewsBTC
4 Month 23 Day Wed
In a recent CryptoQuant Quicktake post, contributor Crazzyblockk highlighted key Bitcoin (BTC) cost basis zones that the leading cryptocurrency must clear – or avoid breaking below – to
placeholder
BNB Price Finds Its Footing — Can Bulls Ignite the Next Leg Up?BNB price is consolidating above the $640 support zone. The price is now showing positive signs and might aim for more gains in the near term. BNB price is attempting to recover from the $640 support
Author  FXStreet
5 Month 16 Day Fri
BNB price is consolidating above the $640 support zone. The price is now showing positive signs and might aim for more gains in the near term. BNB price is attempting to recover from the $640 support
placeholder
EUR/USD Price Forecast: Seems vulnerable below 1.1200, 200-period SMA on H4 holds the keyThe EUR/USD pair ticks higher at the start of a new week amid a softer US Dollar (USD), though it lacks bullish conviction and remains below the 1.1200 round figure through the Asian session.
Author  FXStreet
5 Month 19 Day Mon
The EUR/USD pair ticks higher at the start of a new week amid a softer US Dollar (USD), though it lacks bullish conviction and remains below the 1.1200 round figure through the Asian session.
placeholder
EUR/USD strengthens above 1.1400 as Trump delayed 50% tariffs on EU to July 9The EUR/USD pair gathers strength to near 1.1415 during the early European session on Monday. The Euro (EUR) edges higher against the Greenback as US President Donald Trump extends the deadline for 50% EU tariffs until July 9.
Author  FXStreet
5 Month 26 Day Mon
The EUR/USD pair gathers strength to near 1.1415 during the early European session on Monday. The Euro (EUR) edges higher against the Greenback as US President Donald Trump extends the deadline for 50% EU tariffs until July 9.
goTop
quote