
EOS price climbs as sentiment improves following $3 million purchase by President Trump's World Liberty Financial
- EOS price rebounds from short-term support at $0.75, boosting bullish sentiment amid broader market consolidation.
- President Donald Trump's World Liberty Financial purchases $3 million worth of EOS at an average price of $0.82.
- Technically, EOS's upside potential remains as the RSI indicator changes direction upward.
EOS edges 9% higher, trading around $0.85 on Friday, while prices consolidate in the broader cryptocurrency market. The surge in EOS, rebranding to Vaulta to drive a Web3 banking network, comes amid improved sentiment bolstered by United States (US) President Donald Trump's World Liberty Financial buying the token.
World Liberty Financial scoops 3.636 million EOS
President Trump's World Liberty Financial has sought exposure to the token, spending nearly $3 million in USDT to buy approximately 3.363 million EOS. According to SpotOnChain, the purchase was completed at an average cost of $0.82.
News of the purchase led sentiment around EOS to improve significantly, paving the way for a quick rebound following a drawdown to $0.75 from a weekly peak at $0.99, reached on Saturday. As shown on the daily chart below, a green candle is approaching the short-term resistance at $0.90, which, if broken, could encourage traders to buy EOS, anticipating potential gains beyond the $1.00 supply zone, tested last weekend and in January.
The recovery from the April low at approximately $0.58 places EOS significantly above key moving averages, ranging from the 50-day Exponential Moving Average (EMA) at around $0.72, the 100-day EMA at $0.69, to the 200-day EMA at $0.68. With the moving averages playing catch-up to EOS' price, the path with the least resistance could stay upward, boosting chances of a rally beyond the $1.00 near-term target.
The Relative Strength Index (RSI) indicator's reversal from support slightly above the midline of 50 to 58.65 reflects the growing uptrend's strength. Moreover, traders would look for a daily close above the $0.90 short-term hurdle to ascertain the strength of the uptrend in connection with the upward-moving RSI indicator.
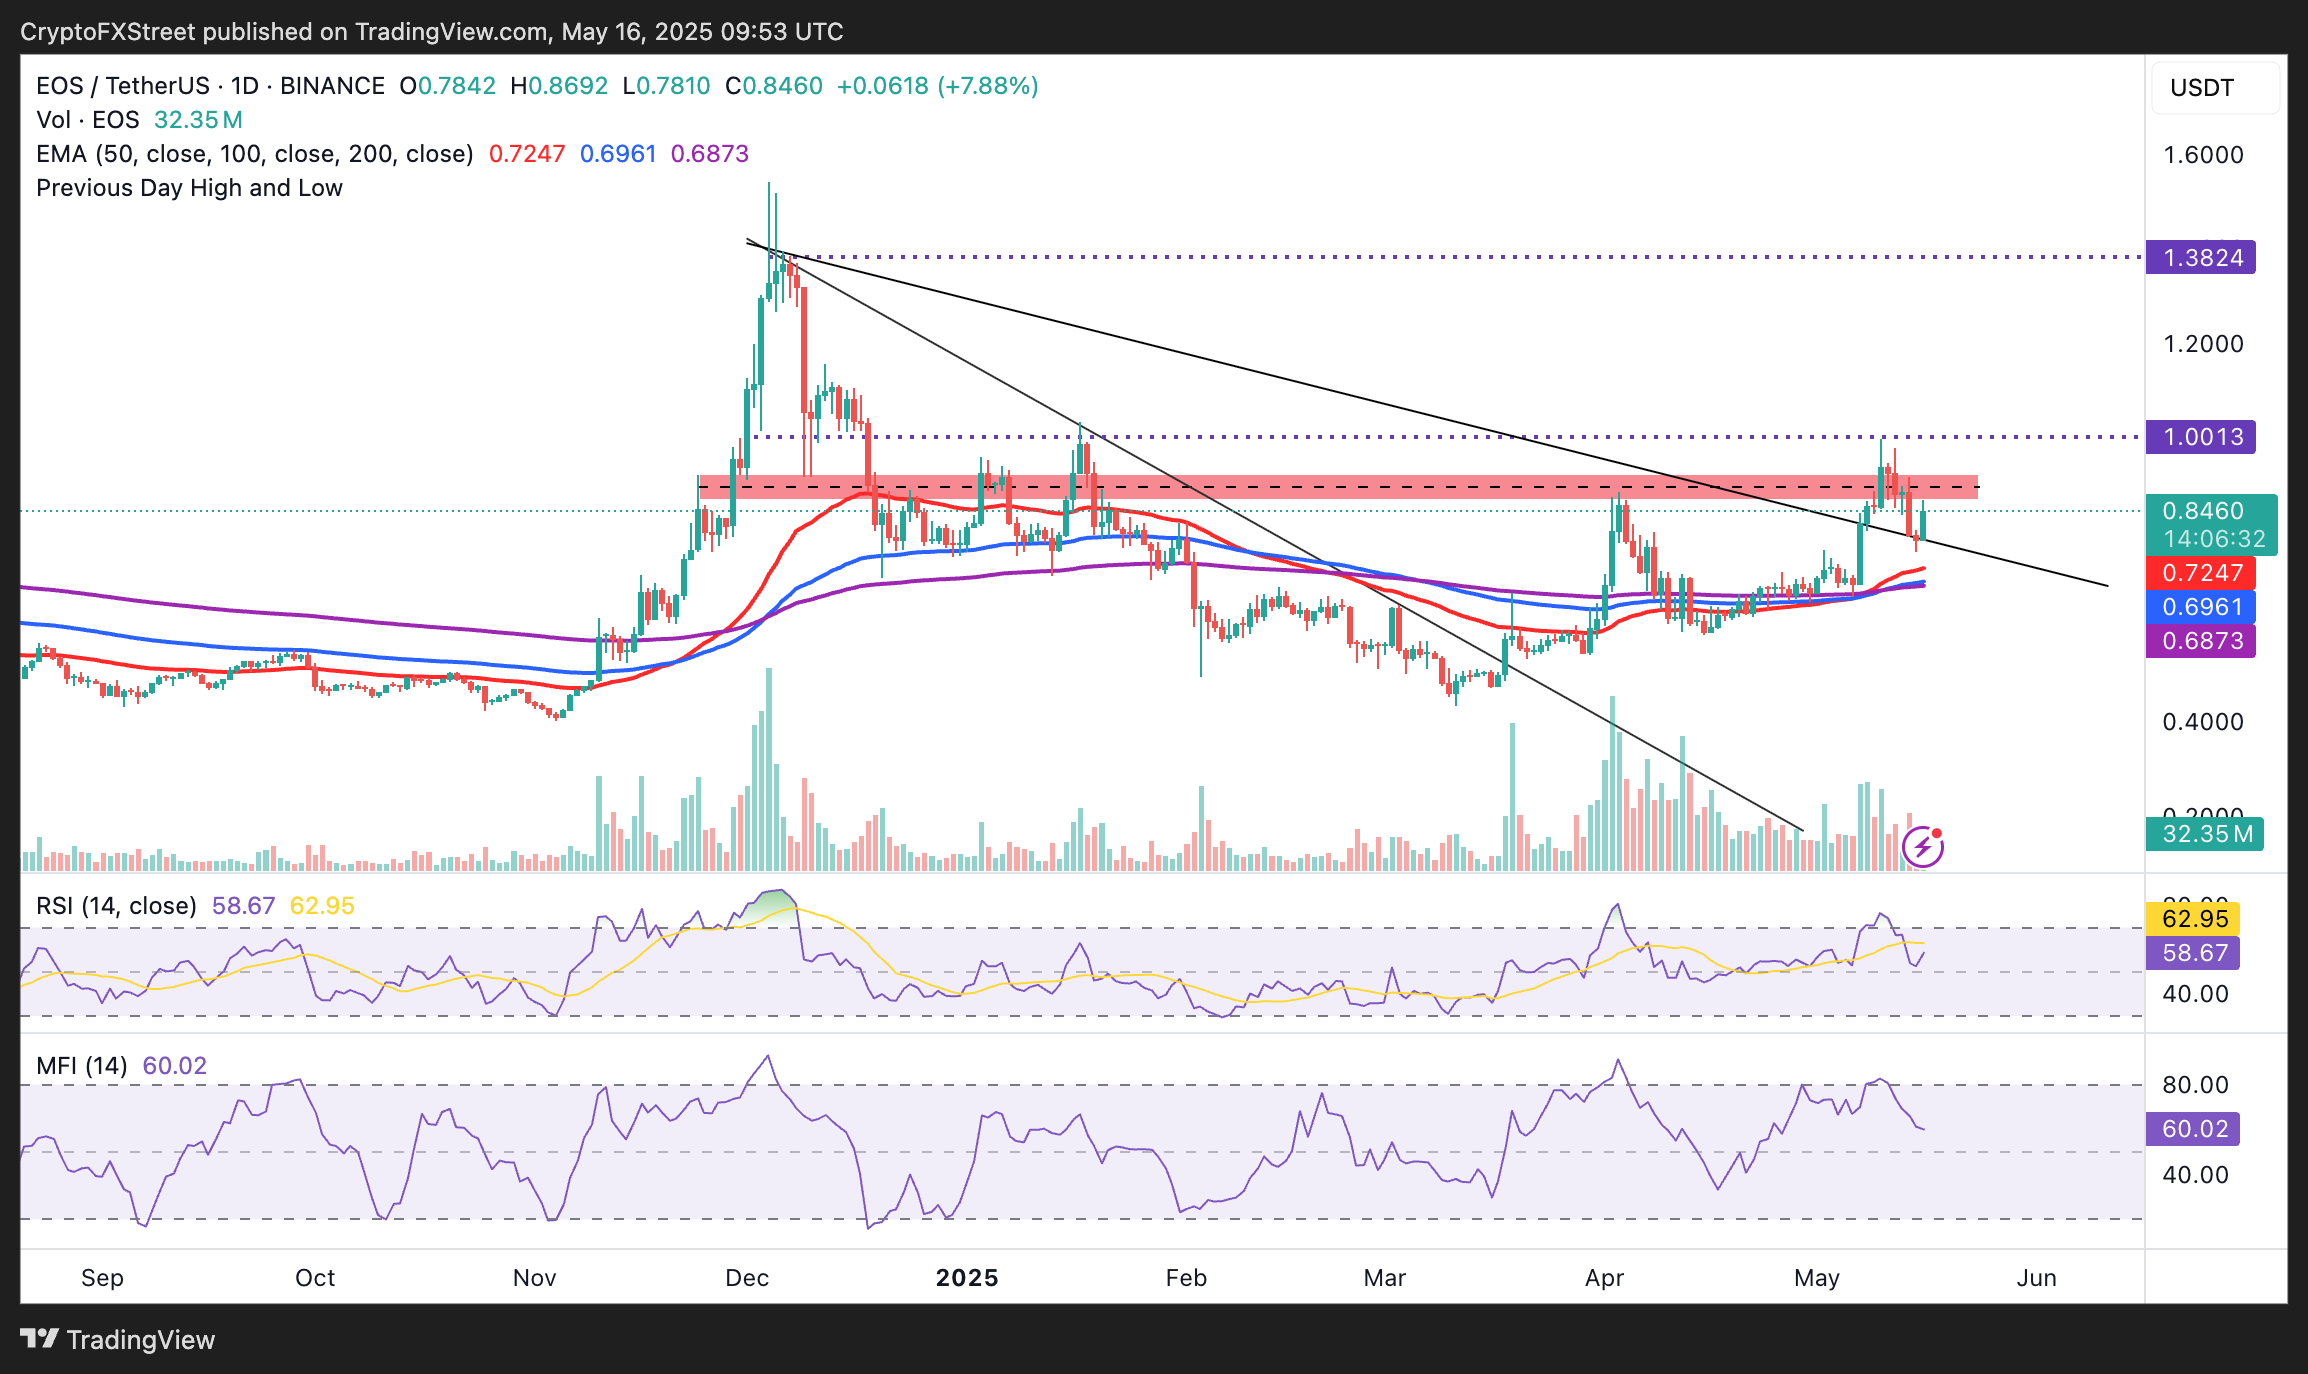
EOS/USD daily chart
On the other hand, the Money Flow Index's (MFI) indicator's drop to 60 suggests that traders should be cautious. The drop indicates that the bullish momentum could be easing, increasing the risk of a reversal in the price of EOS, possibly due to profit-taking.
The MFI is a momentum oscillator that measures money flow into and out of an asset by combining price and volume data. Key monitoring levels include resistance at $0.90 and $1.00, while on the downside, traders should pay attention to tentative support areas at the 50-day EMA around $0.72, the 100-day EMA at $0.69 and the 200-day EMA at $0.68. Beyond the moving averages, market dynamics could shift, bringing into sight the lowest demand area in April at $0.58.
EOS rebrands to Vaulta ahead of token swap to A
EOS has been undergoing a reinvention into a web3 banking platform referred to as Vaulta. The transition started in March, with the token swap from EOS to A scheduled for the end of May.
The crypto project also announced the launch of the Vaulta Banking Advisory Council, which comprises financial and blockchain experts in the industry, focusing on bridging the gap between traditional banking and decentralized systems.
Many exchanges have pledged support for the token swap, including Binance, MEXC, KuCoin, and HTX Global. The network expects more platforms to announce support for the swap before May 26, when the process will kick off.
Cryptocurrency metrics FAQs
The developer or creator of each cryptocurrency decides on the total number of tokens that can be minted or issued. Only a certain number of these assets can be minted by mining, staking or other mechanisms. This is defined by the algorithm of the underlying blockchain technology. On the other hand, circulating supply can also be decreased via actions such as burning tokens, or mistakenly sending assets to addresses of other incompatible blockchains.
Market capitalization is the result of multiplying the circulating supply of a certain asset by the asset’s current market value.
Trading volume refers to the total number of tokens for a specific asset that has been transacted or exchanged between buyers and sellers within set trading hours, for example, 24 hours. It is used to gauge market sentiment, this metric combines all volumes on centralized exchanges and decentralized exchanges. Increasing trading volume often denotes the demand for a certain asset as more people are buying and selling the cryptocurrency.
Funding rates are a concept designed to encourage traders to take positions and ensure perpetual contract prices match spot markets. It defines a mechanism by exchanges to ensure that future prices and index prices periodic payments regularly converge. When the funding rate is positive, the price of the perpetual contract is higher than the mark price. This means traders who are bullish and have opened long positions pay traders who are in short positions. On the other hand, a negative funding rate means perpetual prices are below the mark price, and hence traders with short positions pay traders who have opened long positions.
Recommended Articles


