
Unlocking Cryptocurrency Funding Composition: A Key Guide to Market Trends!
TradingKey - The rise of the cryptocurrency market has changed the global financial landscape. It has sparked growing interest in the composition of market funding. Understanding this composition is crucial for assessing market health, liquidity, and potential future trends. This article analyzes the sources, distribution, and impact of crypto market funds aiming to help investors and institutions better grasp market dynamics.
Cryptocurrency market funding composition refers to the overall structure and sources of capital in the crypto market. By analyzing this composition, we can better understand capital flow patterns, investor behavior, and overall market health—key indicators that help predict future market directions.
The main sources of funding in the crypto market fall into four categories: retail investors, whales, miners, and institutional investors. Each group has distinct characteristics in terms of fund size, investment strategy, and holding period.
Source | Description | Characteristics |
| Individual investors who form the market's foundation. Their funding often reflects market sentiment. | - Typical trades are under $10,000. - High trading frequency, average holding period under 1 month. - Sensitive to FOMO (Fear of Missing Out). |
| Individuals or institutions holding large amounts of crypto. | - Larger investment scale, longer holding periods. - Early participants with low entry costs. |
| Individuals who earn crypto by maintaining blockchain networks and validating transactions. | - Continuous funding, some used for market trading or daily expenses. |
Institutional Investors | Major capital from hedge funds, public companies, and traditional financial institutions. | - Large investments, typically over $1 million. - Average holding period of 6-12 months. - Use professional strategies like quantitative trading and arbitrage. |
Governments and Public Institutions | Countries like the U.S., China, and Ukraine holding Bitcoin. El Salvador invests in Bitcoin. | - Low investment proportion, but adds legitimacy to the market. - Most acquire through confiscation; some explore CBDCs. |
Once new funds enter the crypto market, they typically exist in four forms: Bitcoin, Ethereum, stablecoins, and altcoins. Bitcoin attracts the most capital and often accounts for over 50% of total market share. Combined, Bitcoin (BTC) and Ethereum (ETH) frequently represent over 80% of the market.
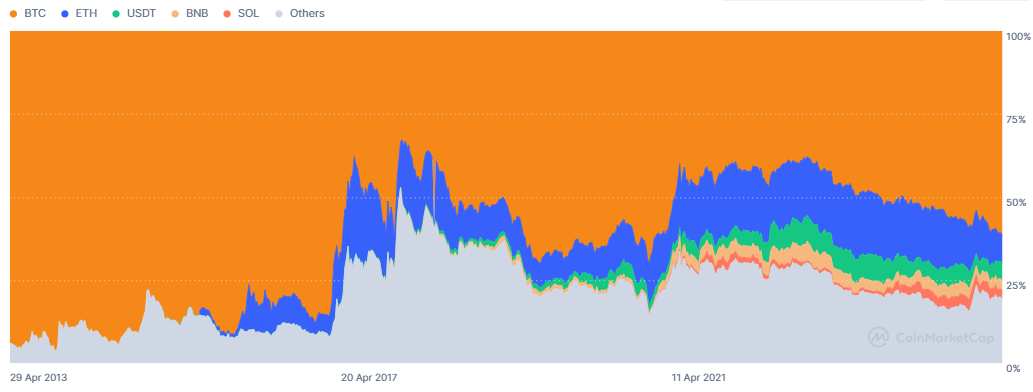
Market Capitalization Shares of BTC, ETH and Other Cryptocurrencies, Source: CoinMarketCap.
Since the inception of cryptocurrency, Bitcoin has consistently held the top spot in terms of market share. Ethereum maintains the second position, with its market share typically fluctuating between 10% and 20%. However, Ethereum faces growing competition from other cryptocurrencies such as Ripple(XRP) and Solana(SOL).
Stablecoins, known for their relative price stability, serve as a critical medium of exchange in crypto trading. As of now, there are over 200 stablecoins with a combined market capitalization of $230 billion—second only to Bitcoin's $1.6 trillion.
Crypto funding primarily exists across Bitcoin, Ethereum, stablecoins, and altcoins. Their market capitalizations fluctuate based on varying market cycles.
In a bull market, liquidity is high. Funds typically enter the market through stablecoins, increasing their total scale. However, this is often a transitional phase as investors eventually convert stablecoins into assets like BTC, ETH, and altcoins, driving up their prices and overall market value. This pattern was especially evident in 2017, 2021, and is expected again in 2024.
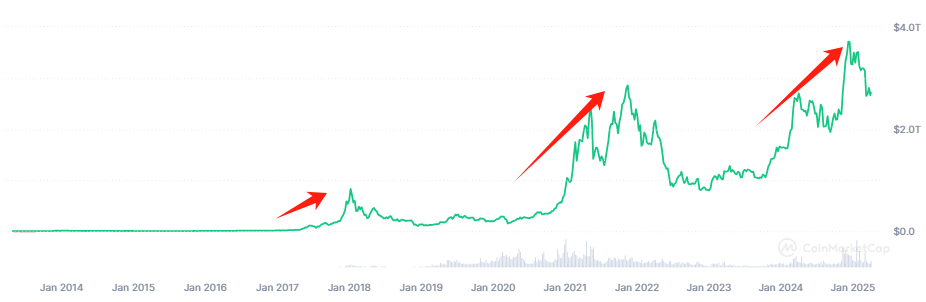
Changes in Total Cryptocurrency Market Capitalization, Source: CoinMarketCap.
In a bear market, capital exits the space, leading to a contraction in overall market cap. This was notable in 2019 and 2022. Investors often shift from volatile assets into stablecoins as a risk mitigation. While the total market cap of stablecoins may decline, their proportional dominance may remain relatively stable.
Typically, Bitcoin’s share decreases during bull markets, while Ethereum and altcoins rise. The opposite occurs in bear markets. For example, during the 2017 bull run, Ethereum’s market share peaked at 31%. By contrast, Bitcoin’s dominance dropped to 38% during the 2018 transition to a bear market.
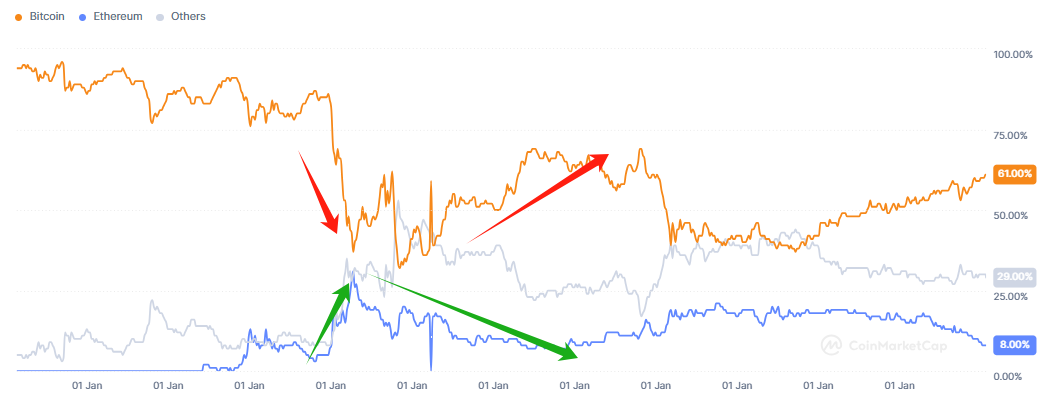
Market Share of Bitcoin, Ethereum, and Other Cryptocurrencies, Source: CoinMarketCap.
Understanding capital flow in the crypto market is crucial for predicting price movements and stability. Key funding data includes on-chain data, exchange data, institutional funding, and DeFi funding flows. Tracking these requires different tools:
Data Type | Key Indicators | Main Tools | Application Scenarios |
On-Chain Data | 1. Exchange net inflow/outflow 2. Whale transfers 3. Miners' holdings 4. Stablecoin supply | - Glassnode - CryptoQuant - Nansen - Whale Alert | - Assess market pressure - Monitor whale activity - Predict trend reversals |
Exchange Data | 1. Exchange reserves 2. Open interest (OI) 3. Funding rate 4. Put/Call ratio | - Coinglass - Laevitas - Deribit Insights | - Observe market leverage - Gauge bullish/bearish sentiment - Predict short-term volatility |
| 1. Grayscale GBTC holdings 2. Public company holdings 3. VC investment trends | - Bitcoin Treasuries - YCharts - Crunchbase | - Follow institutional fund flows - Position for potential investment opportunities |
DeFi Funding | 1. Total Value Locked (TVL) 2. Cross-chain stablecoin flows 3. Smart contract fund movements | - DeFiLlama - Dune Analytics | - Assess DeFi market heat - Monitor fund migration (e.g., from CEX to DeFi) |
It’s essential to use multiple data sources for cross-validation. For example, if on-chain data shows whales accumulating while market sentiment remains fearful, it may indicate a buying opportunity. Combining funding data with technical analysis —such as support and resistance levels— can improve the success rate of trading strategies. Additionally, be aware of data lag, as on-chain metrics reflect past transactions. To gain a fuller picture, pair them with real-time market dynamics and sentiment indicators like fear and greed indices, social media trends, and Google search volumes.
Understanding the funding composition of the cryptocurrency market is key to uncovering underlying market trends. Analyzing funding sources, distribution, and capital flows helps investors and institutions develop more informed and effective strategies. Without this insight, investors risk navigating the market blindly—potentially leading to costly mistakes.
As technology advances and institutional participation grows, the crypto funding ecosystem may evolve. However, its overall structure is unlikely to undergo drastic changes, so there's no need for excessive concern.
Recommended Articles


