
GBP/USD rises past 1.3550 as US–Japan trade deal fuels risk-on rally
- GBP/USD climbs as US–Japan deal lowers tariffs to 15% and secures $550B in Japanese investments.
- BoFA expects summer rebound in GBP despite fragile UK fiscal outlook.
- Traders eye UK and US Flash PMIs and US jobless claims for fresh guidance.
The GBP/USD rose more than 0.30% on Wednesday, boosted by an upbeat risk appetite following the announcement of the US-Japan trade deal, which increased demand for high-beta currencies like the British Pound and other commodity currencies. At the time of writing, the pair trades at 1.3574, having hit a daily low of 1.3515.
Pound gains over 0.30% as improved sentiment lifts high-beta currencies despite lingering UK fiscal concerns
On Tuesday, US President Donald Trump announced that an agreement had been reached, under which Japanese imports to the US would be subject to 15% tariffs. Previously, the White House sent a letter to Japan, fixing duties at 25%, including automobiles. The deal would compel Japan to invest hundreds of billions of dollars in the US, with approximately $550 billion in funds tied for US investments.
Even though the Pound has been weakening due to fiscal concerns, analysts at Bank of America (BoFA) expressed that Q3 for the British economy could be good.
They said “We feel the conditions are now in place for a bounce in GBP through the summer months,” adding that “We do not understate the fragile state of UK public finances but continue to be struck by how markets are willing to find the UK guilty of fiscal breaches before being (given) the opportunity of proving innocence.”
Ahead this week, the UK economic docket will feature S&P Global Flash PMIs preliminary reading for July. Across the pond, the US economic docket will also feature Flash PMIs, alongside the release of Initial Jobless Claims data for the week ending July 19.
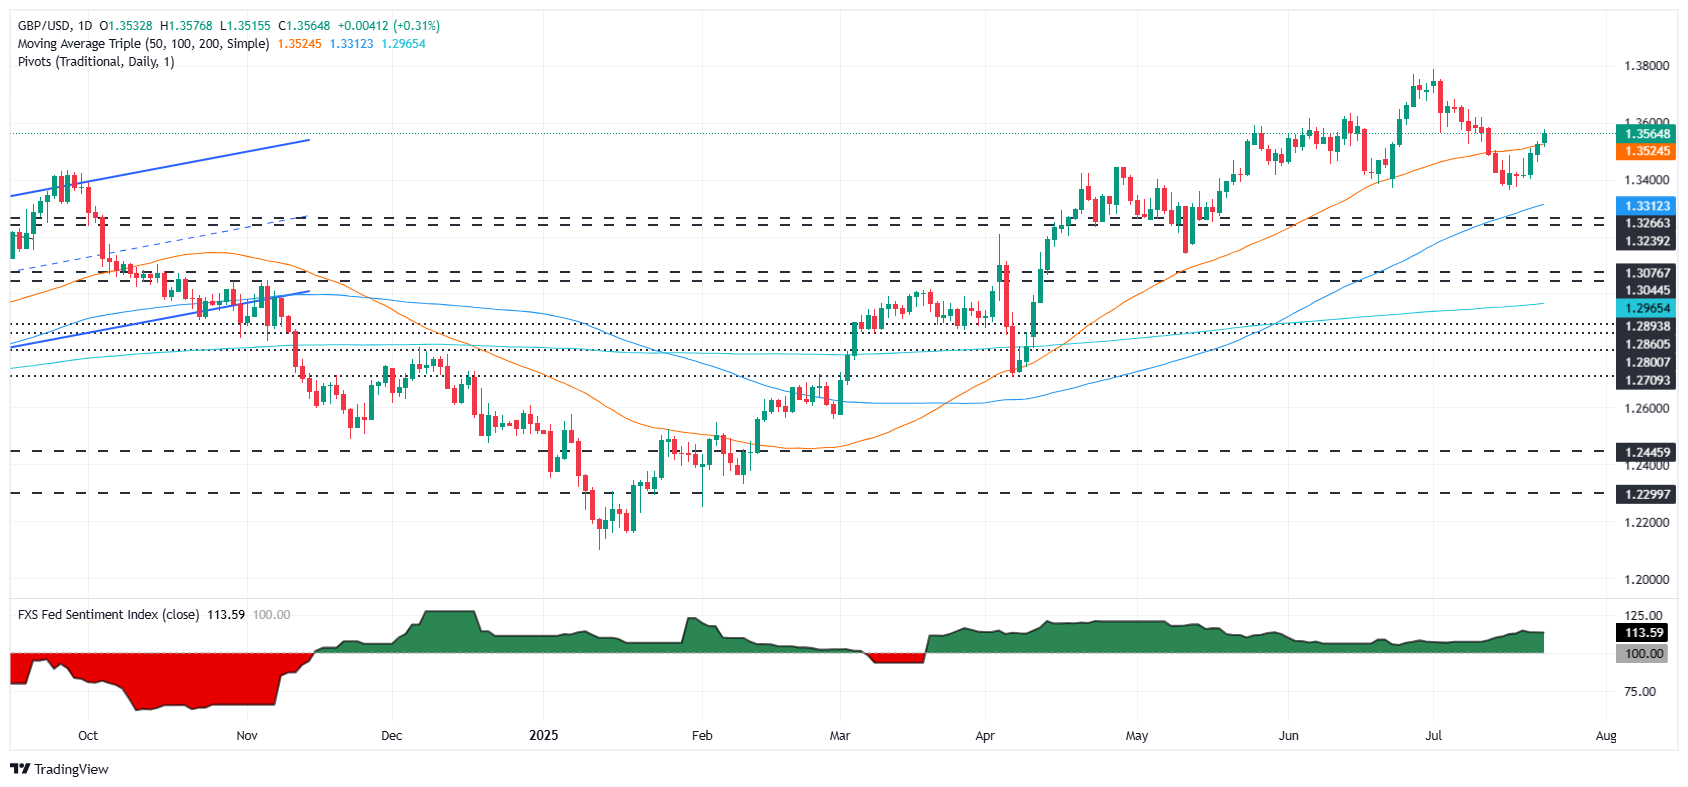
GBP/USD Price Forecast: Technical outlook
From a technical standpoint, the uptrend remains intact, but the GBP/USD needs to clear the 20-day SMA at 1.3564. Momentum indicates that buyers are gathering steam as depicted by the Relative Strength Index (RSI).
That said, if the pair clears the 20-day SMA, the next resistance would be the 1.3600 figure. A breach of the latter will expose the 1.3650 mark, followed by 1.3700. Conversely, if GBP/USD drops below the 50-day SMA at 1.3520, the next support would be 1.3500. Further demand levels lie underneath, with the 1.3402 July 21 daily low.
British Pound PRICE This week
The table below shows the percentage change of British Pound (GBP) against listed major currencies this week. British Pound was the strongest against the US Dollar.
| USD | EUR | GBP | JPY | CAD | AUD | NZD | CHF | |
|---|---|---|---|---|---|---|---|---|
| USD | -1.03% | -1.13% | -1.01% | -0.76% | -1.14% | -1.12% | -1.01% | |
| EUR | 1.03% | -0.02% | 0.02% | 0.23% | -0.16% | -0.28% | -0.02% | |
| GBP | 1.13% | 0.02% | -0.18% | 0.30% | -0.10% | -0.03% | 0.20% | |
| JPY | 1.01% | -0.02% | 0.18% | 0.24% | -0.09% | -0.16% | 0.18% | |
| CAD | 0.76% | -0.23% | -0.30% | -0.24% | -0.30% | -0.34% | -0.27% | |
| AUD | 1.14% | 0.16% | 0.10% | 0.09% | 0.30% | -0.04% | 0.28% | |
| NZD | 1.12% | 0.28% | 0.03% | 0.16% | 0.34% | 0.04% | 0.24% | |
| CHF | 1.01% | 0.02% | -0.20% | -0.18% | 0.27% | -0.28% | -0.24% |
The heat map shows percentage changes of major currencies against each other. The base currency is picked from the left column, while the quote currency is picked from the top row. For example, if you pick the British Pound from the left column and move along the horizontal line to the US Dollar, the percentage change displayed in the box will represent GBP (base)/USD (quote).
Recommended Articles


