
GBP/USD hits 1.36 as soft US PPI, jobless claims fuel rate cut bets
- GBP/USD advances on Thursday, boosted by US PPI figures and jump on Initial Jobless Claims.
- UK GDP shrank 0.3% in April, biggest monthly drop since late 2022.
- Markets now price in 52 bps of Fed cuts by year-end, weakening USD.
GBP/USD extended its gains on Thursday following the release of another inflation report in the United States (US), which increased the odds that the Federal Reserve (Fed) could resume its easing cycle sooner than expected. This, along with a rise in jobless claims, was a tailwind for Sterling, which trades at 1.3600 against the US Dollar (USD), up by over 0.47%.
Sterling climbs over 0.45% on Thursday as US data boosts Fed rate cut expectations, despite UK GDP slump
The US Bureau of Labor Statistics (BLS) revealed that the Producer Price Index (PPI) in May increased by 2.6% YoY, two-tenths above April’s reading. At the same time, core PPI – which excludes volatile items like Food and Energy – dipped from 3.1% to 3% YoY.
Today’s data, along with the release of softer inflation figures on the consumer side, prompted investors to fully price in 52 basis points of interest rate cuts by the Fed towards the year’s end. So far, the effect of controversial tariffs imposed by the Trump administration hasn’t been reflected on inflation data.
Other data revealed that the number of Americans filling for unemployment benefits rose. Initial Jobless Claims for the week ending June 7 rose by 248K, unchanged but above forecasts of 240K.
In the UK, the April Gross Domestic Product (GDP) figures revealed the most significant economic contraction in 18 months, with GDP coming in at -0.3% month-over-month (MoM). Following the data, traders increased bets that the Bank of England (BoE) could continue to reduce rates in 2025, pricing in two rate cuts so far.
Although the number warranted a broad US Dollar weakness, as seen in the GBP/USD, caused by policies implemented by Washington, keeping the USD pressured.
Ahead, the UK economic schedule will be absent. In the US, traders will eye the University of Michigan Consumer Sentiment.
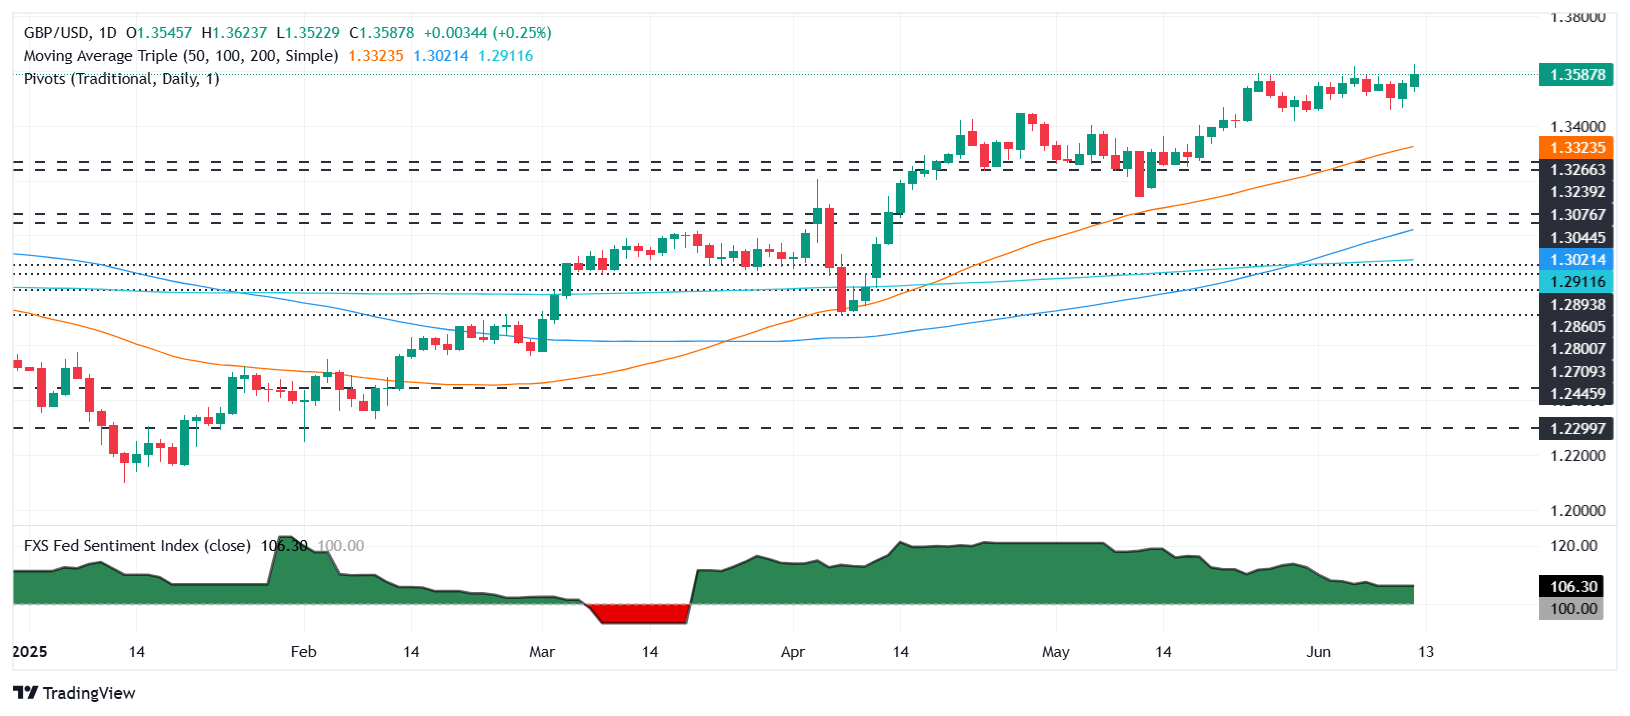
GBP/USD Price Forecast: Technical outlook
The GBP/USD remains upward biased, but despite hitting a yearly high of 1.3623, buyers were unable to hold prices above 1.36. Momentum remains bullish, as depicted by the Relative Strength Index (RSI), poised to reach overbought territory.
That said, the GBP/USD first resistance would be the YTD high at 1.3626, followed by 1.37 and 1.3750. Conversely, if the pair remains below 1.36, this clears the path to challenge the 20-day Simple Moving Average (SMA) at 1.3521, followed by 1.35 and the 50-day SMA at 1.3319.
British Pound PRICE This week
The table below shows the percentage change of British Pound (GBP) against listed major currencies this week. British Pound was the strongest against the US Dollar.
| USD | EUR | GBP | JPY | CAD | AUD | NZD | CHF | |
|---|---|---|---|---|---|---|---|---|
| USD | -1.57% | -0.44% | -0.83% | -0.57% | -0.39% | -0.71% | -1.05% | |
| EUR | 1.57% | 1.13% | 0.73% | 0.99% | 1.21% | 0.85% | 0.52% | |
| GBP | 0.44% | -1.13% | -0.31% | -0.14% | 0.08% | -0.28% | -0.61% | |
| JPY | 0.83% | -0.73% | 0.31% | 0.26% | 0.40% | 0.07% | -0.33% | |
| CAD | 0.57% | -0.99% | 0.14% | -0.26% | 0.18% | -0.14% | -0.48% | |
| AUD | 0.39% | -1.21% | -0.08% | -0.40% | -0.18% | -0.35% | -0.69% | |
| NZD | 0.71% | -0.85% | 0.28% | -0.07% | 0.14% | 0.35% | -0.33% | |
| CHF | 1.05% | -0.52% | 0.61% | 0.33% | 0.48% | 0.69% | 0.33% |
The heat map shows percentage changes of major currencies against each other. The base currency is picked from the left column, while the quote currency is picked from the top row. For example, if you pick the British Pound from the left column and move along the horizontal line to the US Dollar, the percentage change displayed in the box will represent GBP (base)/USD (quote).
Recommended Articles


