
GBP/USD slips below 1.33 as US consumer sentiment turns negative, boosts USD
- UoM Consumer Sentiment plunges to 50.8, lowest since July 2022; inflation expectations rise sharply.
- US housing data mixed, import prices rise unexpectedly; Powell, Jefferson caution against premature easing.
- UK data void leaves Sterling adrift; traders await key UK inflation, flash PMIs, and Retail Sales next week.
The Pound Sterling retreats against the US Dollar during the North American session, poised to end the week with minimal losses of over 0.24%. An absent economic docket in the UK on Friday left traders adrift to US data, which revealed that consumers are becoming pessimistic about the economy. The GBP/USD trades at 1.3276, down 0.39%
GBP/USD wavers and is poised to end the week negatively, despite dismal US consumer data
Recently, the University of Michigan revealed that May’s Consumer Sentiment index fell to its lowest level since July 2022, at 50.8, below forecasts for an improvement to 53.8, down from April’s 52.2. The poll also showed that inflation expectations for the next year rose from 6.5% to 7.3% and for the next five years jumped from 4.4% to 4.6%.
Other US data showed that import prices increased unexpectedly in April, due to a surge oin the cost of capital goods and a weaker US Dollar. US housing data was mixed with housing starts rising in April, while Building Permits fell to an almost two-year low.
The GBP/USD delayed reacting to US data but drifted below 1.33. On Thursday, Fed Chair Jerome Powell revealed that “Certain aspects of the Fed's approach are permanent, such as the focus on inflation expectations.”
So far, US economic data released during the week have shown an evolution in the disinflation process. Nevertheless, Fed officials remained reluctant to ease policy as they remained uncertain about US trade policies, tariffs, and their effects on inflation. Fed’s Governor Jefferson stressed that a reacceleration of inflation could be temporary or persistent.
On the growth front, Retail Sales continued to decelerate in April. However, the latest update from the Atlanta Fed GDP Now suggests that the US economy could grow at a rate of 2.4%, down from 2.5% a day ago, the Atlanta Fed revealed.
Next week, the UK economic docket will feature the UK-European Union meeting alongside the release of the UK’s inflation figures, flash PMIs, and Retail Sales. In the US, a flurry of Fed speakers, flash PMIs, and housing data will be eyed.
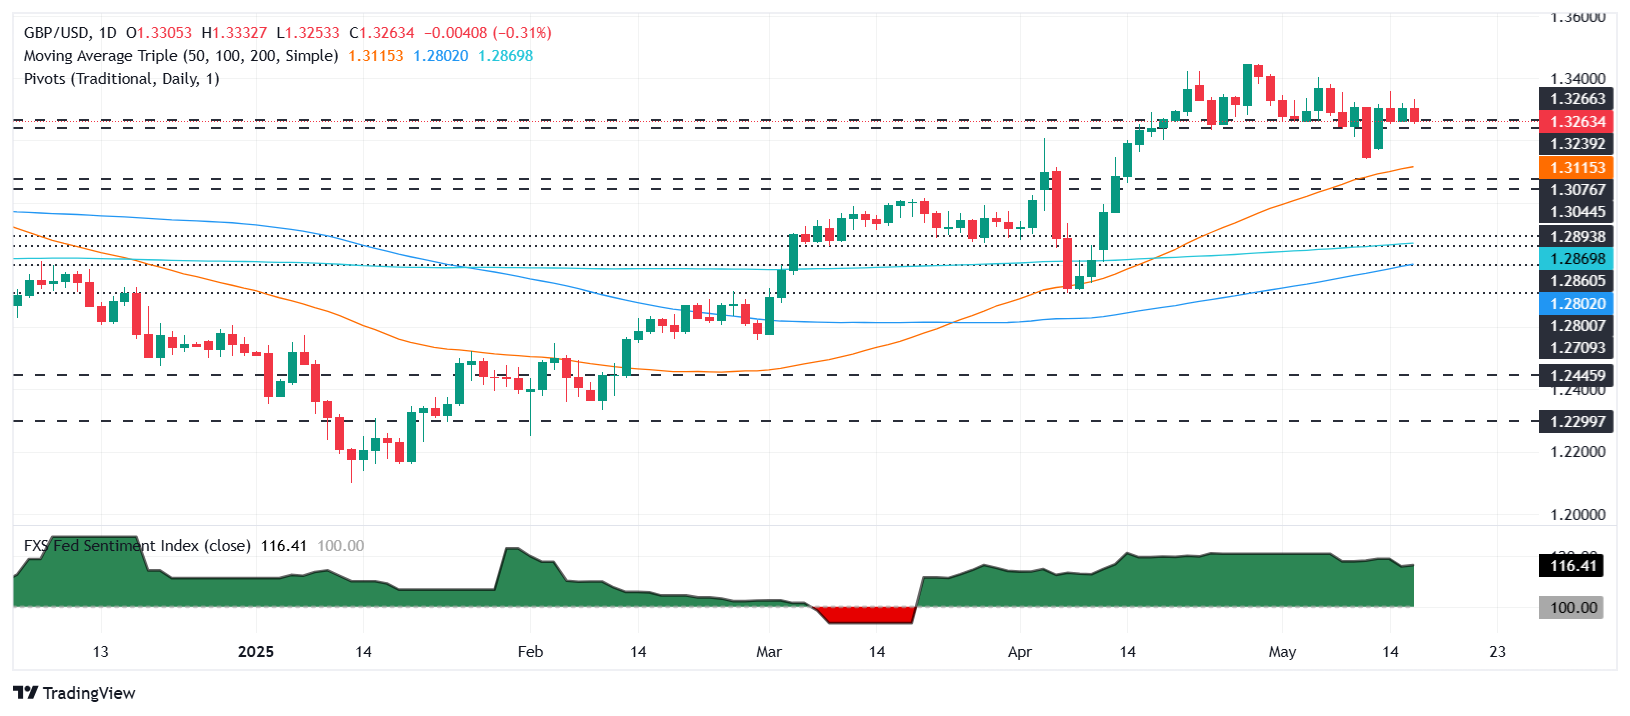
GBP/USD Price Chart: Technical outlook
The GBP/USD has dropped below 1.33, and it might close the week beneath the latter. This could pave the way for a pullback, though sellers must clear the May 15 daily low of 1.3248, so they could challenge the 50-day Simple Moving Average (SMA) at 1.3112. On further weakness, the next support would be the 1.3000 mark.
Conversely, if GBP/USD ends above 1.33, buyers could test 1.3350. A clear break of that level could expose the year-to-date (YTD) peak at 1.3443.
British Pound PRICE This week
The table below shows the percentage change of British Pound (GBP) against listed major currencies this week. British Pound was the strongest against the New Zealand Dollar.
| USD | EUR | GBP | JPY | CAD | AUD | NZD | CHF | |
|---|---|---|---|---|---|---|---|---|
| USD | 0.89% | 0.34% | -0.19% | 0.63% | 0.35% | 0.90% | 0.58% | |
| EUR | -0.89% | -0.41% | -0.50% | 0.24% | 0.10% | 0.49% | 0.17% | |
| GBP | -0.34% | 0.41% | 0.08% | 0.65% | 0.52% | 0.84% | 0.59% | |
| JPY | 0.19% | 0.50% | -0.08% | 0.82% | -0.09% | 0.23% | 0.54% | |
| CAD | -0.63% | -0.24% | -0.65% | -0.82% | -0.02% | 0.26% | -0.07% | |
| AUD | -0.35% | -0.10% | -0.52% | 0.09% | 0.02% | 0.29% | 0.05% | |
| NZD | -0.90% | -0.49% | -0.84% | -0.23% | -0.26% | -0.29% | -0.35% | |
| CHF | -0.58% | -0.17% | -0.59% | -0.54% | 0.07% | -0.05% | 0.35% |
The heat map shows percentage changes of major currencies against each other. The base currency is picked from the left column, while the quote currency is picked from the top row. For example, if you pick the British Pound from the left column and move along the horizontal line to the US Dollar, the percentage change displayed in the box will represent GBP (base)/USD (quote).
Recommended Articles


