


EUR/JPY Price Forecast: Holds above 172.00; bullish technical setup backs positive outlook
- EUR/JPY scales higher for the second straight day on Friday amid a broadly weaker JPY.
- The technical setup favors bullish traders and backs the case for further appreciation.
- Dips towards mid-171.00 could be bought into and remain limited near 200-SMA on H4.
The EUR/JPY cross attracts some buyers for the second consecutive day on Friday as the uncertainty over the likely timing of the next rate hike by the Bank of Japan (BoJ) undermines the Japanese Yen (JPY). Spot prices, however, struggle to capitalize on the intraday move up beyond mid-172.00s, warranting some caution before positioning for any further positive move.
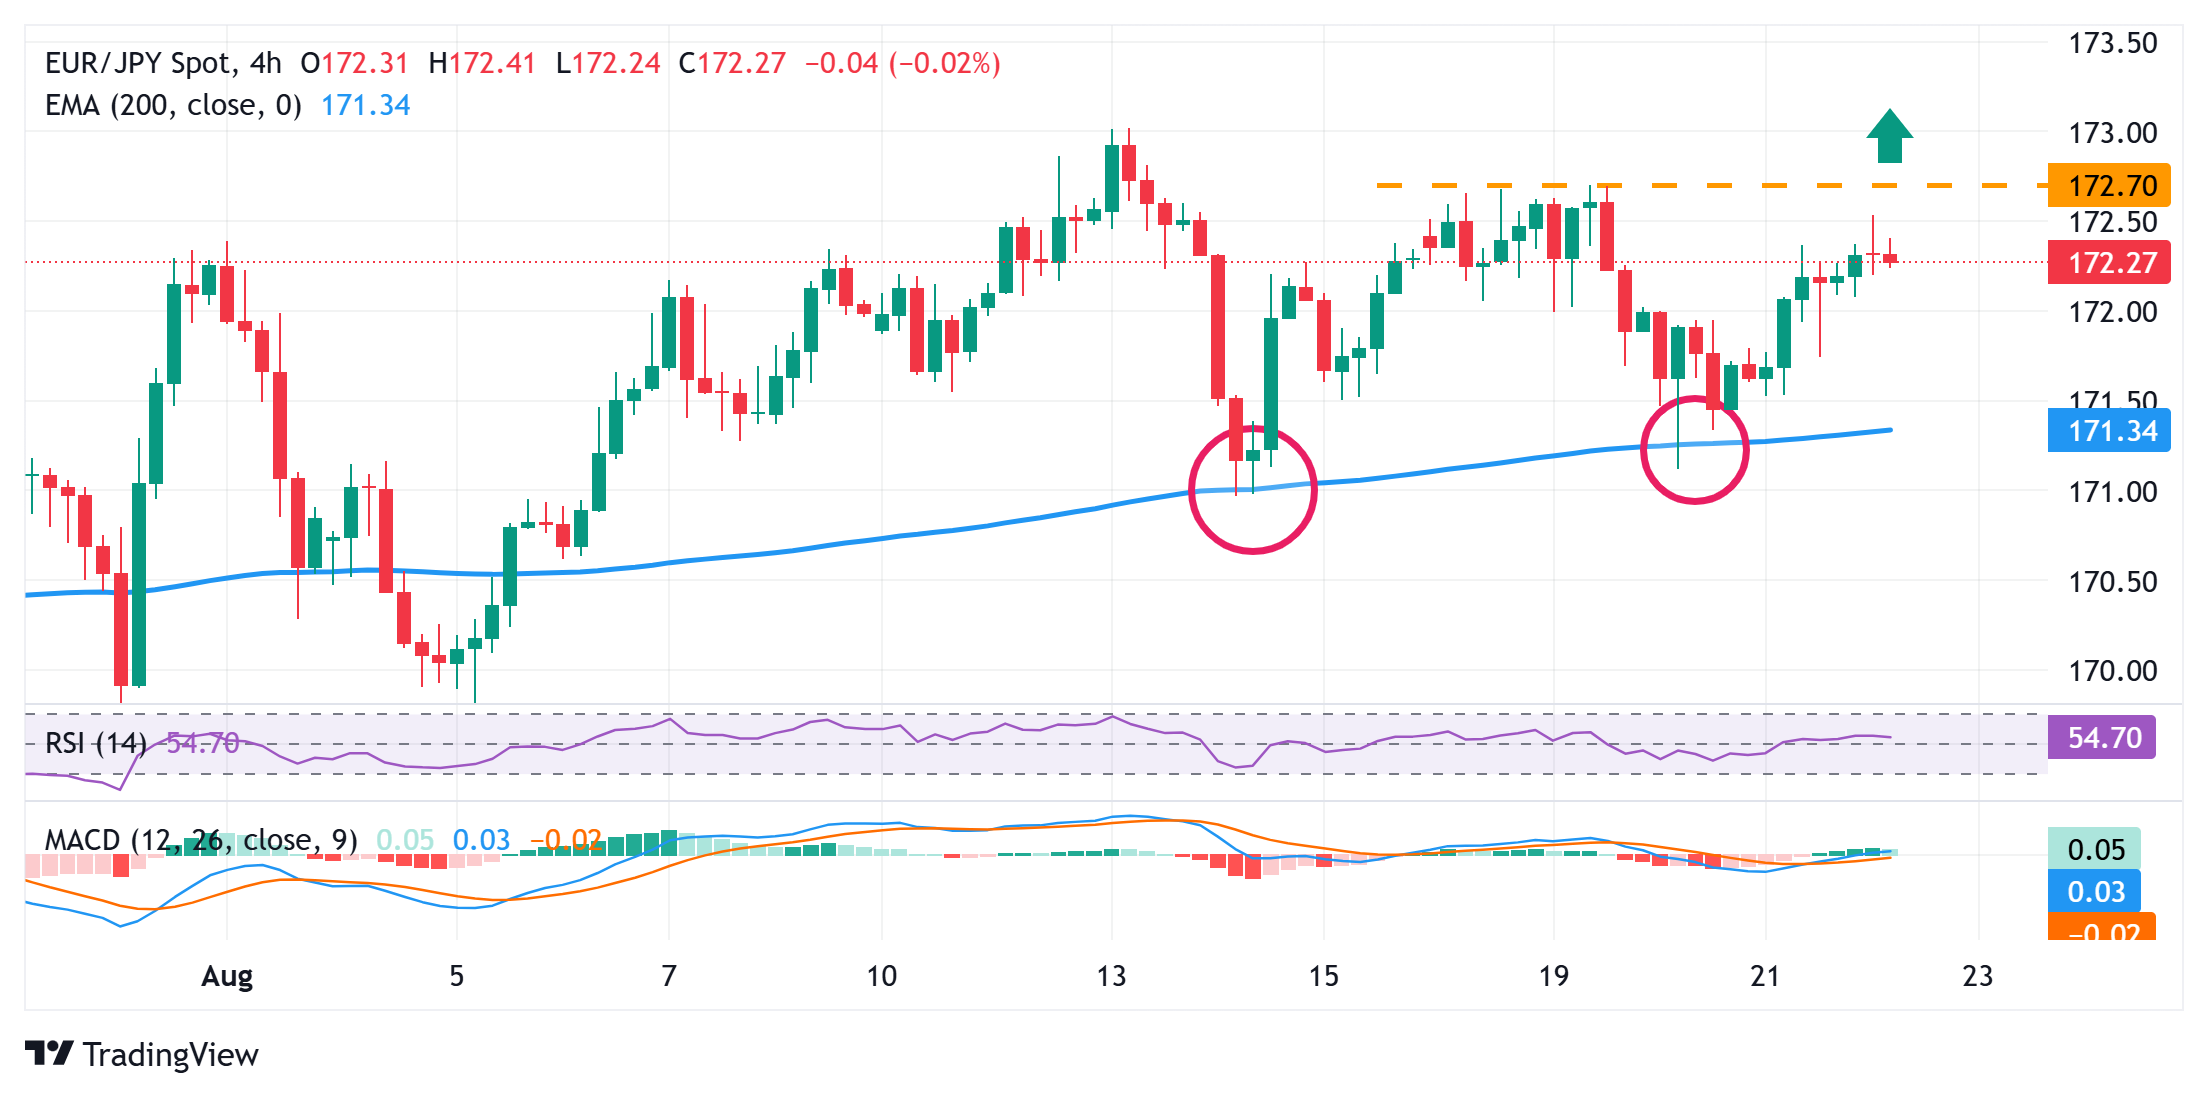
Looking at the broader picture, the recent repeated rebounds from the 200-period Exponential Moving Average (EMA) on the 4-hour chart and the subsequent move up favor the EUR/JPY bulls. This, along with positive oscillators on hourly/daily charts, suggests that the path of least resistance for spot prices is to the upside. Some follow-through buying beyond the 172.70 area, or the weekly high, will reaffirm the positive outlook and pave the way for additional gains.
The EUR/JPY cross might then aim to surpass the monthly peak, around the 173.00 mark, and climb further towards the 173.60 intermediate hurdle en route to the 174.00 neighborhood, or a one-year high touched in July. A sustained strength beyond the latter should allow spot prices to extend the momentum towards the 174.50 barrier en route to the 175.00 psychological mark and the July 2024 swing high, around the 175.40-175.45 region.
On the flip side, weakness below the 172.00 mark might attract some buyers near the 171.50 horizontal support. This should help limit the downside for the EUR/JPY cross near the 200-period SMA on the 4-hour chart, currently pegged around the 171.25 area. However, some follow-through selling, leading to a subsequent break below the 171.00 round figure, would negate the constructive setup and shift the near-term bias in favor of bearish traders.
EUR/JPY 4-hour chart
Japanese Yen Price Today
The table below shows the percentage change of Japanese Yen (JPY) against listed major currencies today. Japanese Yen was the strongest against the Swiss Franc.
| USD | EUR | GBP | JPY | CAD | AUD | NZD | CHF | |
|---|---|---|---|---|---|---|---|---|
| USD | 0.20% | 0.09% | 0.25% | 0.03% | 0.08% | 0.16% | 0.27% | |
| EUR | -0.20% | -0.07% | 0.05% | -0.15% | -0.16% | -0.02% | 0.10% | |
| GBP | -0.09% | 0.07% | 0.12% | -0.08% | -0.09% | 0.07% | 0.17% | |
| JPY | -0.25% | -0.05% | -0.12% | -0.23% | -0.17% | -0.16% | -0.04% | |
| CAD | -0.03% | 0.15% | 0.08% | 0.23% | -0.00% | 0.13% | 0.24% | |
| AUD | -0.08% | 0.16% | 0.09% | 0.17% | 0.00% | 0.14% | 0.25% | |
| NZD | -0.16% | 0.02% | -0.07% | 0.16% | -0.13% | -0.14% | 0.11% | |
| CHF | -0.27% | -0.10% | -0.17% | 0.04% | -0.24% | -0.25% | -0.11% |
The heat map shows percentage changes of major currencies against each other. The base currency is picked from the left column, while the quote currency is picked from the top row. For example, if you pick the Japanese Yen from the left column and move along the horizontal line to the US Dollar, the percentage change displayed in the box will represent JPY (base)/USD (quote).
Recommended Articles


