
Tron DEX trading volume hits yearly peak near $750M as TRX eyes upside to $0.26

TRX price holds firm above weekly support at $0.244, with a potential upside target of $0.260.
Tron’s DEX trading volume reaches a new yearly high of over $750 million, signaling increased user activity and liquidity.
Stablecoin market capitalization on Tron nears $72 billion, indicating sustained demand and growing ecosystem trust.
Tron (TRX) price holds firm above its support level, trading around $0.247 at the time of writing on Tuesday, with a potential upside target of $0.260 if the support level continues to hold. Tron’s decentralized exchange (DEX) trading volume reaches a yearly high of over $750 million, signaling increased user activity and liquidity. Stablecoin market capitalization on Tron nears $72 billion, indicating sustained demand and growing ecosystem trust.
Tron shows positive bias as DEX volume surges, stablecoin demand grows
Crypto intelligence tracker DefiLlama data shows that on Tuesday, the TRX chain decentralized exchange (DEX) trading volume rose to a new year-to-date high of $751.08 million. This volume signaled increased user activity and liquidity in the TRX blockchain, boosting its bullish outlook.
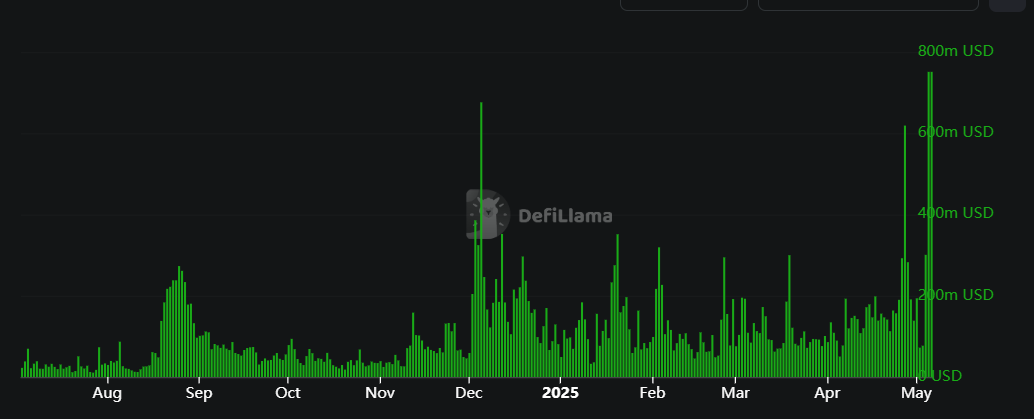
TRX DEX trading volume chart. Source: DefiLlama
Additionally, the value of stablecoins on the Tron blockchain has steadily risen since mid-March. According to DefiLlama data, the stablecoin market capitalization currently stands at $71.93 billion, a new all-time high (ATH). Such stablecoin activity and value increase on the TRX project indicate a bullish outlook, as it indicates sustained demand and growing ecosystem trust, which can attract more users to the ecosystem, driven by Decentralized Finance (DeFi), meme coins, and payment use cases.
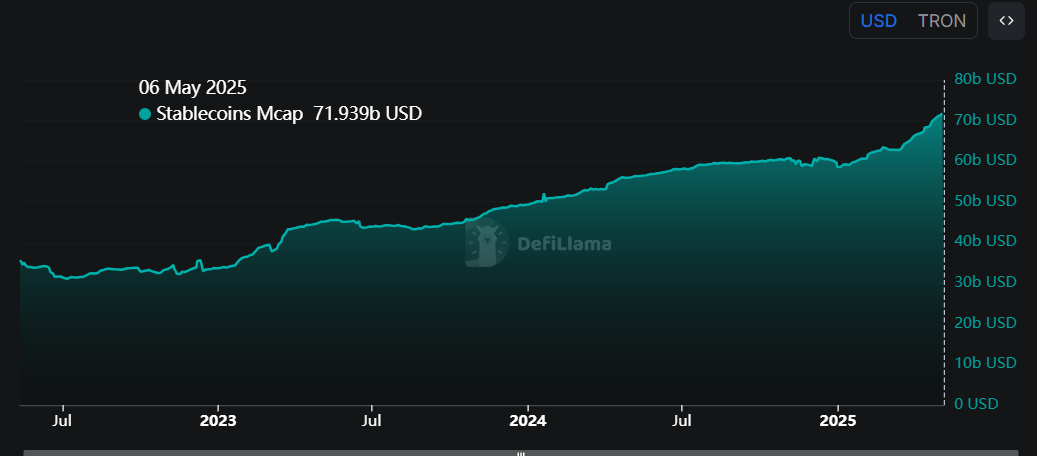
TRX stablecoin Mcap chart. Source: DefiLlama
Tron Price Forecast: TRX bulls could target $0.26 if weekly support remains strong
Since last week, the Tron price has been consolidating around its weekly support level of $0.244. At the time of writing on Tuesday, it trades slightly down at around $0.247.
If the weekly level at $0.244 holds and TRX rallies above it, it could extend the gains and retest its April 14 high of $0.259.
The Relative Strength Index (RSI) hovers around its neutral level of 50, indicating indecisiveness among traders. For the bullish momentum to be sustained, the RSI must move above 60 for a rally ahead. Moreover, the Moving Average Convergence Divergence indicator also coils against each other, indicating indecisiveness among TRX investors. The MACD should show a bullish crossover for an uptrend ahead.
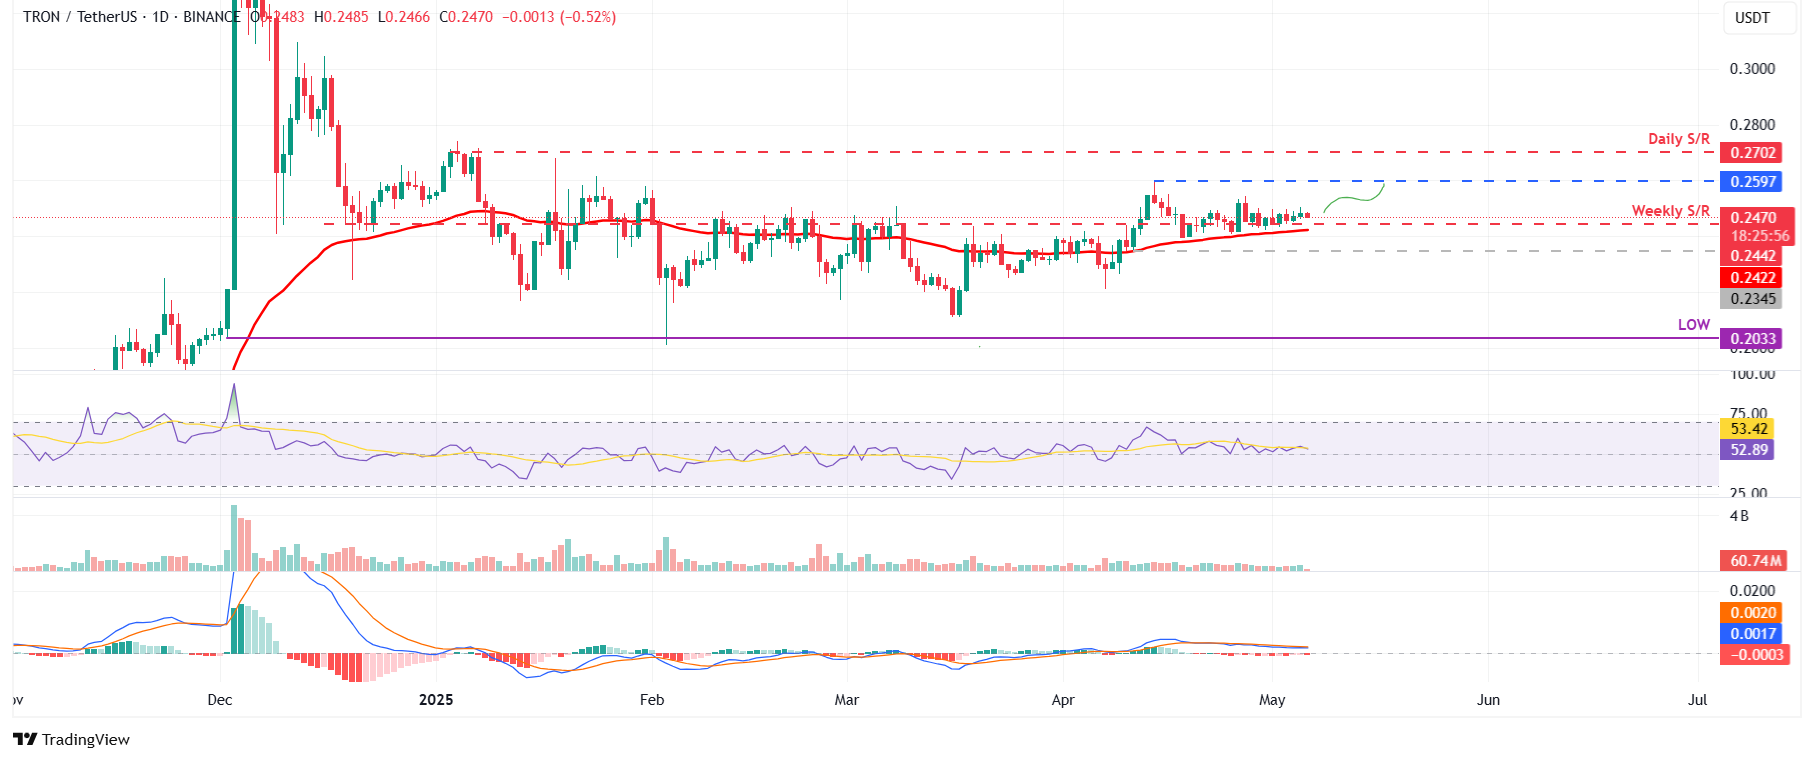
TRX/USDT daily chart
However, if TRX closes below the weekly level of $0.244, it could extend the decline to retest its April 11 low of $0.234.
* The content presented above, whether from a third party or not, is considered as general advice only. This article should not be construed as containing investment advice, investment recommendations, an offer of or solicitation for any transactions in financial instruments.


