
Top 3 Price Prediction: Bitcoin, Ethereum, Ripple – BTC stabilizes while ETH and XRP hold key levels


Bitcoin price steadies around $109,000 on Monday after hitting a record high of $111,900 last week, signaling potential consolidation.
Ethereum finds support at the 200-day EMA near $2,447, keeping recovery prospects in play.
XRP rebounds off the $2.30 level, showing resilience despite waning bullish momentum.
Bitcoin (BTC), Ethereum (ETH), and Ripple (XRP) are showing signs of stabilization at the start of the week following recent bouts of volatility. BTC is consolidating after setting a new all-time high, while ETH and XRP are holding above key support levels, suggesting bulls may still have a chance to reclaim control.
Bitcoin consolidates after setting a new all-time high
Bitcoin price reached a new all-time high (ATH) of $111,900 on Thursday and declined 3.92% the next day. However, it found support around the $106,406 daily level on Saturday and recovered slightly the next day. At the time of writing on Monday, it continues to recover, trading at around $109,600.
If BTC continues to recover and closes above its ATH, it could extend the rally toward a key psychological level of $120,000.
The Relative Strength Index (RSI) on the daily chart reads 67, pointing upward toward its overbought level of 70, indicating bulls are still in control of the momentum. However, the Moving Average Convergence Divergence (MACD) indicator on the daily chart converges, indicating indecisiveness among the traders.
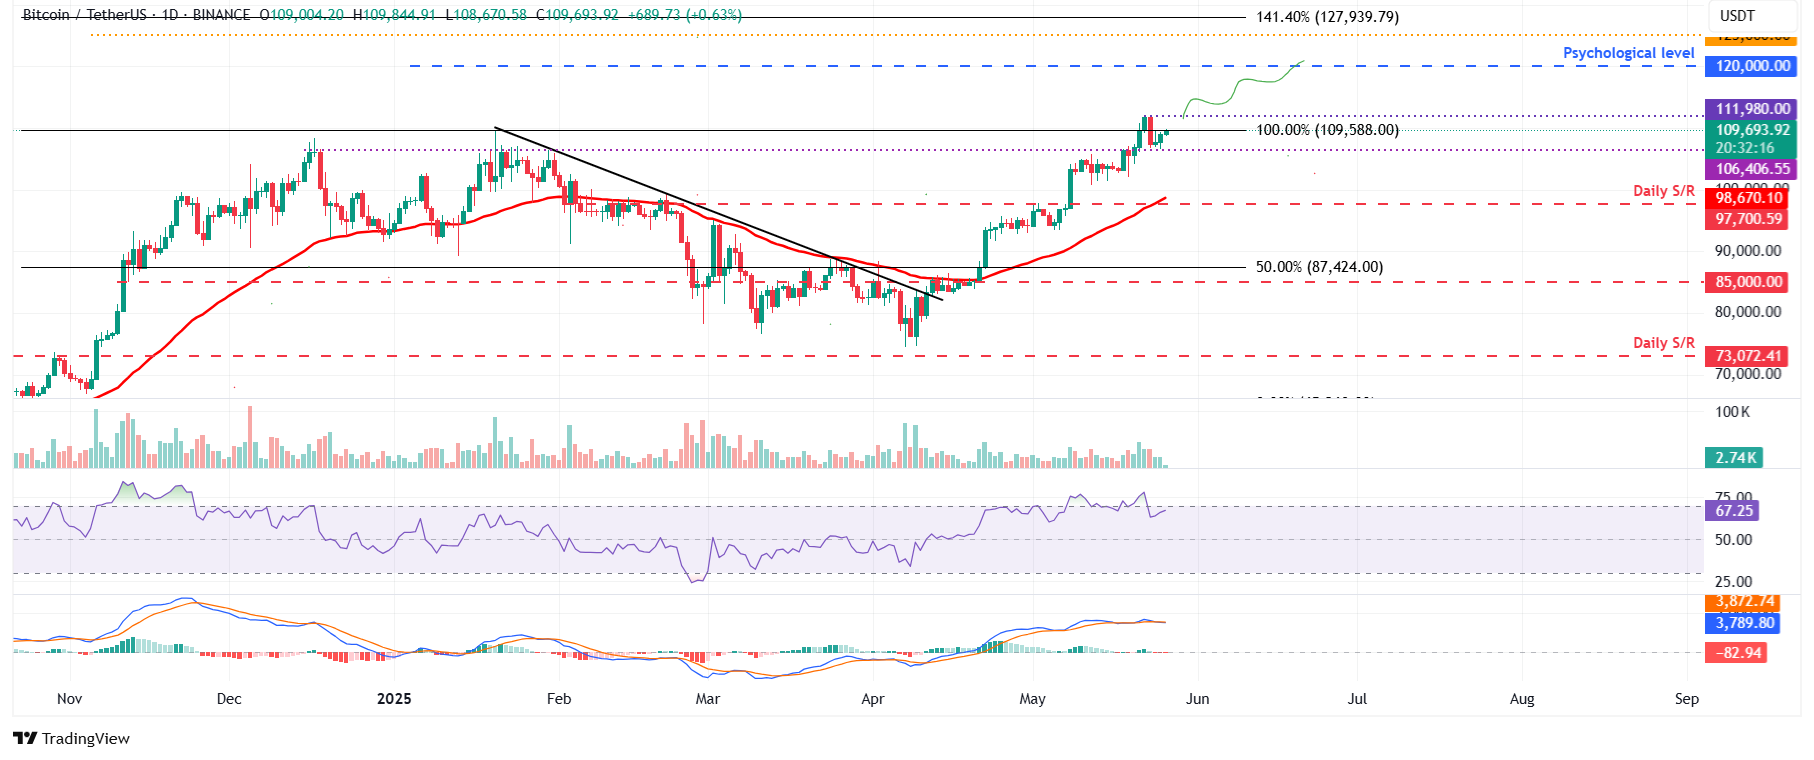
BTC/USDT daily chart
However, if BTC faces a pullback and closes below $106,406 daily support, it could extend the correction to retest its next key support at $100,000.
Ethereum could recover if the 200-day EMA holds
Ethereum price faced rejection around its daily level at $2,724 on Friday and declined 5.12%. ETH retested and found support around its 200-day Exponential Moving Average (EMA) at around $2,447 during the weekend. At the time of writing on Monday, it trades at around $2,500.
If the 200-day EMA at $2,447 holds support, ETH could extend the recovery to retest its daily resistance at $2,724.
The RSI on the daily chart reads 64, below its overbought level of 70, indicating the bulls still have room for upside. However, traders should be cautious as the MACD indicator showed a bearish crossover on Friday, giving sell signals and indicating a downward trend ahead.
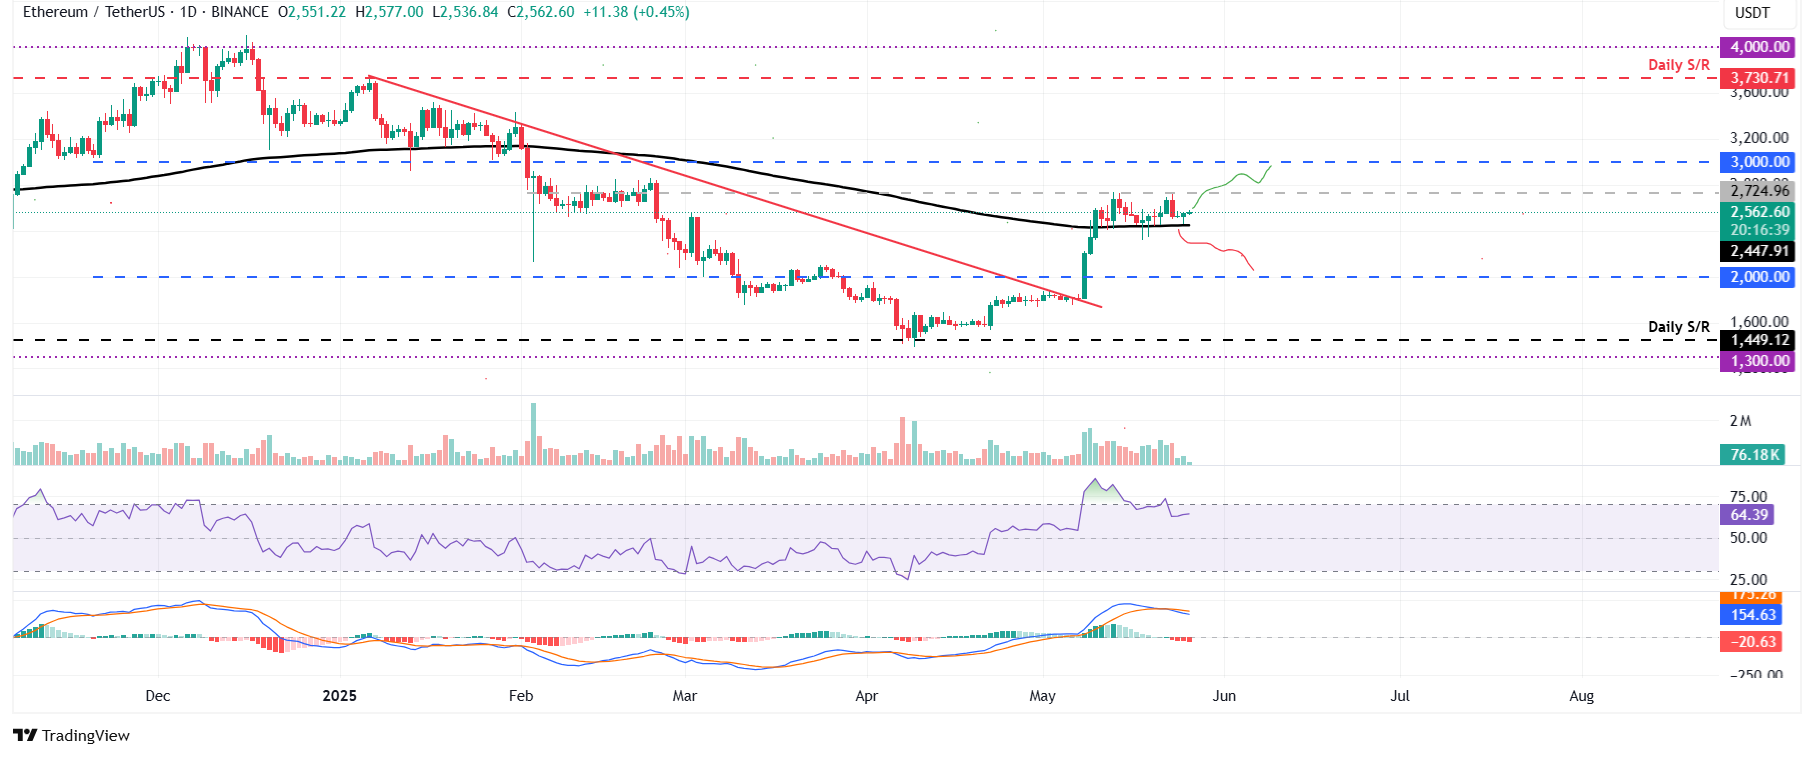
ETH/USDT daily chart
On the other hand, if ETH breaks and closes below the 200-day EMA at $2,447, it could extend the decline to reach its next support at $2,000.
XRP remains above its 50-day EMA
XRP price declined 5.53% on Friday and found support around its 50-day EMA at $2.30 during the weekend. At the time of writing on Monday, it continues to hover above this support at around $2.34.
If the 50-day EMA continues to hold as support, XRP could extend the recovery to retest its next resistance level at $2.72.
The RSI on the daily chart flattens at around its neutral level of 50, indicating indecisiveness among the traders. However, investors should be cautious as the MACD indicator showed a bearish crossover last week, giving sell signals and indicating a downward trend ahead.
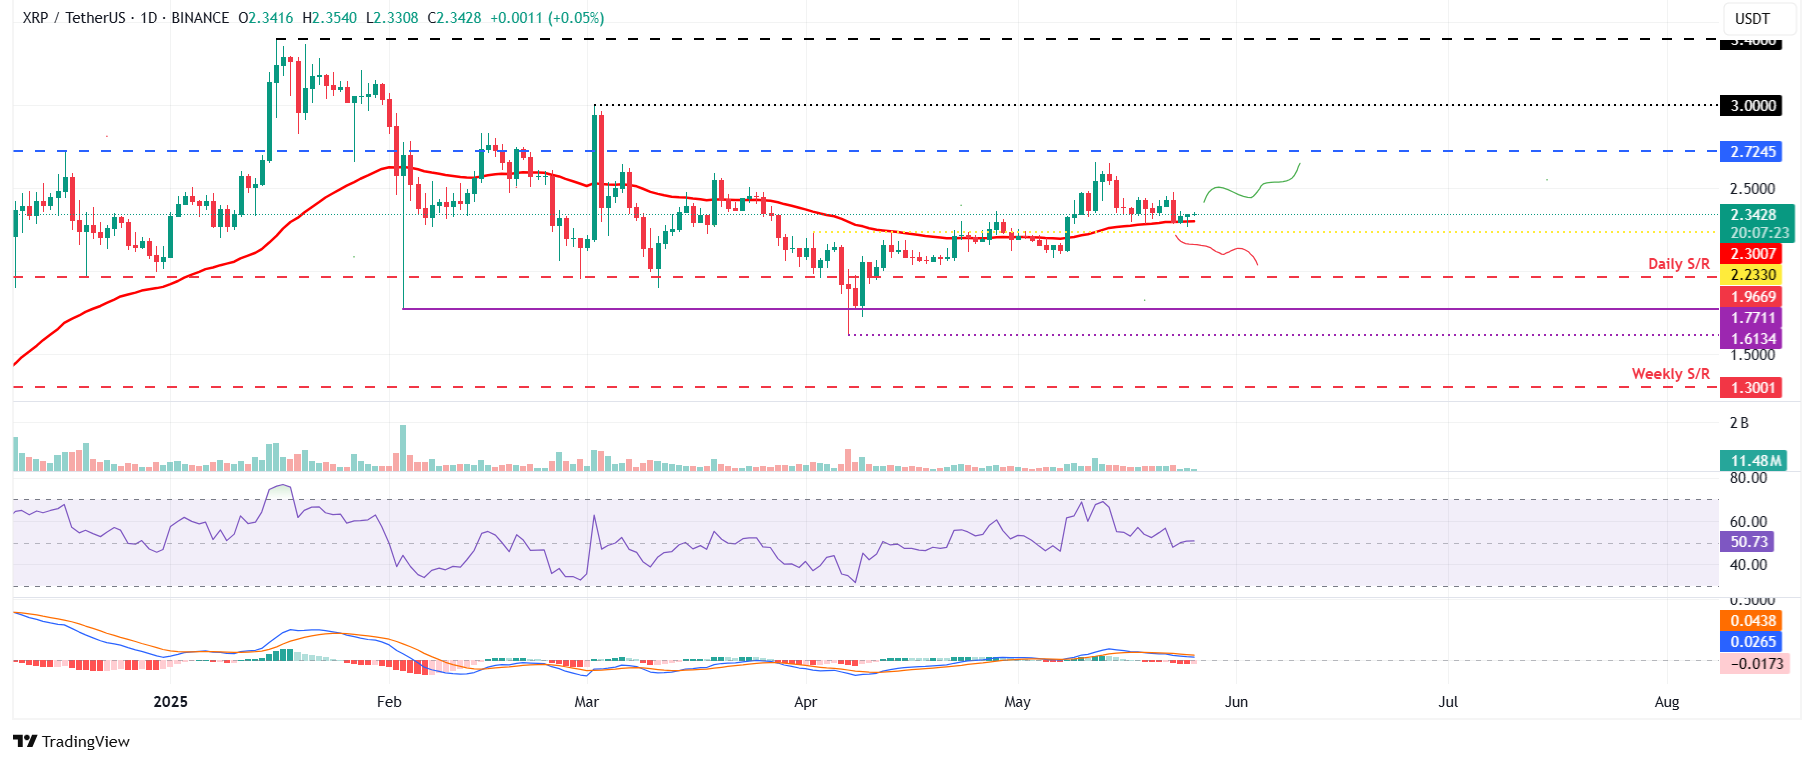
XRP/USDT daily chart
However, if XRP breaks and closes below its 50-day support, it could extend the decline to retest its next daily support at $2.23.
* The content presented above, whether from a third party or not, is considered as general advice only. This article should not be construed as containing investment advice, investment recommendations, an offer of or solicitation for any transactions in financial instruments.


