


Trouble in U.S. Fiscal Discontinuity: Does a Credit Downgrade Matter? Who Are Bond Vigilantes?
TradingKey - Since the beginning of the 21st century, rising government spending and accelerating debt expansion have made U.S. fiscal sustainability a growing concern.
In May 2025, Moody’s downgraded the U.S. sovereign credit rating, marking the first time in history that the United States simultaneously lost its AAA ratings from all three major credit agencies — Standard & Poor’s (2011), Fitch (2023), and now Moody’s (2025). This development has intensified global investor concerns over U.S. fiscal health.
As the world's largest economy, why does the U.S. keep facing fiscal challenges? What does losing the final AAA rating mean for U.S. Treasury bonds? And how will the so-called “bond vigilantes” respond?
Why Is the U.S. Fiscal Deficit Worsening?
Thanks to the dollar’s dominant reserve currency status, the U.S. government has been able to continuously issue debt to fund various expenditures. While U.S. fiscal policy remained relatively stable during most of the 20th century — with budget surpluses or deficits typically within ±5% of GDP — high-deficit spending has become the norm since the 21st century.
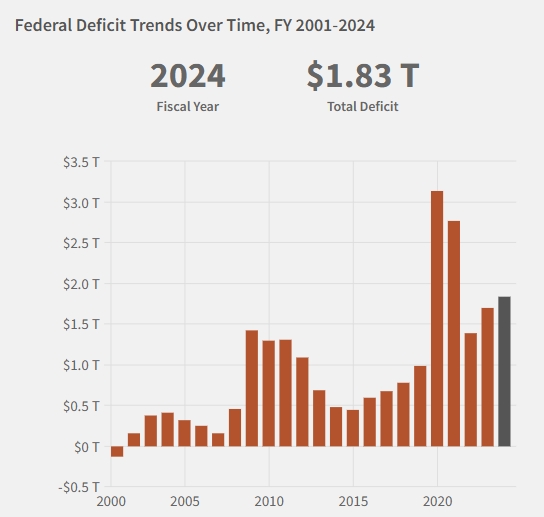
Federal deficit over time, Source:fiscaldata
The shift toward large, persistent deficits began with the transformation of the U.S. government from a "small government" to a "large government." War funding, economic crises, welfare state building, and tax cuts laid the foundation for chronic deficit spending.
Since the turn of the century, structural factors such as tax reforms, explosive growth in social welfare spending, and rising interest costs on record-high debt levels have led to an irreversible trend of structural fiscal deficits.
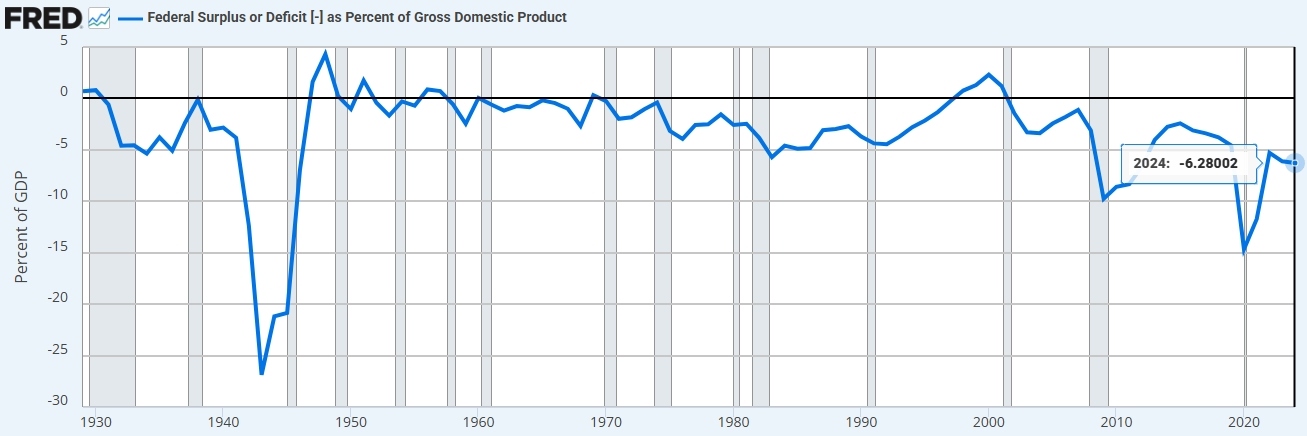
Federal surplus or deficit to GDP, Source: Stlouisfed
Key Drivers of the U.S. Fiscal Crisis:
1.Structural Spending Growth That’s Hard to Curb
- Social welfare and healthcare costs are ballooning. Social Security, Medicare, and Medicaid account for about half of total federal spending. With an aging population and rising medical costs, these programs will face even greater pressure.
- Defense spending remains rigid. To maintain its global military presence and strategic deployments, U.S. defense spending stays high. In FY2024, the U.S. defense budget reached $886 billion, setting a new record and accounting for 40% of global military spending.
- Interest costs are rising. Growing debt and higher interest rates have increased the burden of U.S. borrowing. In FY2024, net interest expenses reached 3.06% of GDP, the highest since 1996 — surpassing defense spending for the first time.
2.Insufficient Revenue Growth and Tax Reform Challenges
- Tax revenue growth lags behind GDP growth. Personal income tax and payroll taxes remain the main sources of revenue, which rise moderately with economic growth. Federal revenue as a percentage of GDP fell slightly from 18% in 2015 to 17%.
- Tax loopholes reduce actual collections. Many corporations and individuals exploit legal tax breaks, weakening government revenues.
- Long-term tax cuts without offsetting increases. Despite reliance on personal income taxes (49% of FY2024 revenue), corporate tax receipts have declined. Alternative revenue sources are scarce, yet further tax cuts continue.
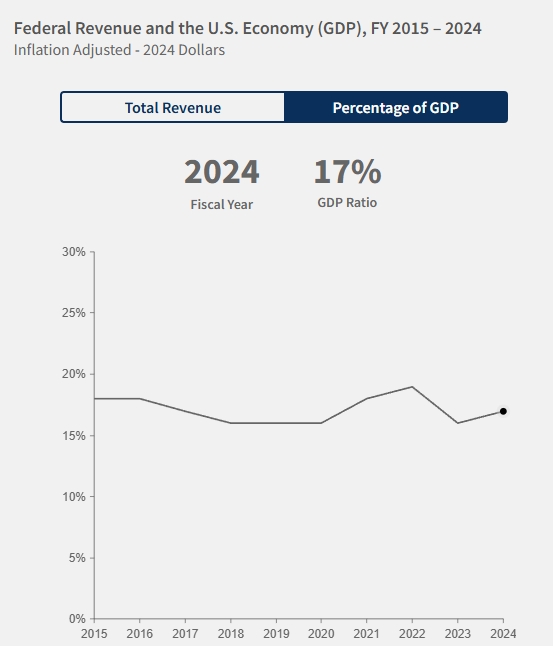
Federal revenue and GDP, Source: fiscaldata
3.Political Gridlock and Debt-Dependent Model
- Partisan battles stall reform. Although both parties support tax cuts, they remain divided on spending priorities, making structural fiscal reform difficult.
- Budget process breakdown. Congress increasingly relies on Continuing Resolutions (CRs) rather than formal budget processes to avoid shutdowns, turning the debt ceiling into a political tool and creating a vicious cycle of deficits.
- Financialized governance model. The debt-driven growth model is temporarily supported by dollar dominance but erodes long-term economic foundations. Investor confidence in U.S. assets may waver due to debt inertia and uncertainty.
RIA Advisors highlights two additional root causes of U.S. fiscal imbalance:
- Low fiscal efficiency: According to Keynesian theory, government spending should stimulate demand → economic activity → investment → tax revenue. But U.S. deficit spending often (88% of every tax dollar goes to non-productive spending) goes toward non-productive uses like welfare and debt repayment, leading to negative returns.
- Abuse of Continuing Resolutions: From 2008 to 2025, no U.S. budget was passed through normal procedures. Instead, CRs became the norm, enabling continuous debt ceiling breaches and driving up fiscal imbalances.
What Does Losing the AAA Rating Mean?
On May 16, 2025 , Moody’s downgraded the U.S. sovereign credit rating from Aaa to Aa1, citing high debt levels, rising interest costs, and worsening future deficits. It projected that the U.S. federal deficit would rise from 6.4% of GDP in 2024 to 9% by 2035 , while debt-to-GDP would jump from 98% to 134% .
This marks the first downgrade of U.S. credit by Moody’s since 1917, officially removing the U.S. from having any AAA rating from the top three agencies.
While a downgrade theoretically raises borrowing costs and reduces investor confidence, Wall Street reacted more calmly this time. After the announcement, 10-year and 30-year Treasury yields initially rose but then retreated, and U.S. stocks opened lower but recovered later in the day.
Top analysts offered varied views:
- UBS and Goldman Sachs argued that the downgrade is unlikely to trigger a massive sell-off in U.S. Treasuries.
- Wells Fargo noted that the market had already priced in the deteriorating fiscal path before the downgrade.
- Bianco Research pointed out that unlike in 2011, current financial contracts do not rely solely on AAA-rated collateral, reducing the risk of forced sales.
- TradingKey Senior Economist Jason Tang believes that markets have become desensitized to downgrades after S&P (2011) and Fitch (2023). He remains optimistic about U.S. equities, citing the Fed’s rate-cutting cycle, ongoing tax cuts, and strong corporate earnings.
What Are the "Bond Vigilantes"?
During periods of U.S. fiscal instability, a mysterious group often mentioned in the media is the "bond vigilantes" — investors who push back against unsustainable policies by selling U.S. Treasuries.
First coined by economist Edward Yardeni in 1983, the term refers to bond investors who signal dissatisfaction with fiscal or monetary policies by selling government debt, thereby pressuring policymakers to adjust course. As Yardeni noted, if fiscal and monetary authorities won’t manage the economy responsibly, the bond market will.
Bond vigilantes operate as a market-based check on excessive government borrowing or loose monetary policy. They are not a single entity but represent a collective force within the bond market.
Their actions usually involve selling Treasuries, which pushes bond yields higher and increases the cost of government borrowing — something policymakers aim to avoid.
They are often described as the self-policing mechanism of the bond market, targeting issues such as excessive bond issuance and inflationary risks.
In April 2025, following Trump’s announcement of reciprocal tariffs, bond investors sold off Treasuries amid fears of renewed inflation. Just 13 hours after the tariff announcement, Trump reversed course and suspended some tariffs for 90 days.
Although he did not explicitly cite the Treasury selloff as the direct reason, Trump acknowledged that the bond market was “very tricky.” Yardeni called it another victory for the bond vigilantes.
With Moody’s downgrade and ongoing debates over Trump’s tax cuts, many believe the bond vigilantes could strike again.
Bloomberg analysts warn that as the market reassesses fiscal risk, term premiums may rise, pushing bond yields higher.
Wall Street veteran Stephen Jen warns that a "Truss moment" may be needed to force a change in direction — referring to former UK Prime Minister Liz Truss, whose unfunded tax cuts triggered a market crash and led to her resignation just four days into office.
How Should We View the Bond Vigilantes?
Public opinion on bond vigilantes is mixed:
- On one hand, they help enforce fiscal discipline , reducing the risk of long-term economic imbalances driven by political expediency.
- On the other hand, their reactions can sometimes exacerbate crises , as seen during the European debt crisis .
Since the 2000s, central banks' adoption of unconventional monetary policies — such as quantitative easing, near-zero interest rates, and direct intervention — has significantly weakened the influence of bond vigilantes.
Historical Examples of Bond Vigilante Action
There are numerous historical cases where bond vigilantes successfully pressured governments to change course:
1.UK Debt Crisis of 1976 – An Early Case
- Facing severe fiscal deficits and inflation, investors dumped British pounds and gilts, forcing the UK to seek IMF assistance and commit to austerity measures.
2.Reagan Era High Deficits (1980s)
- Reagan’s tax cuts and military buildup pushed deficits higher. Ten-year Treasury yields briefly hit double digits. The U.S. eventually adopted the Gramm-Rudman Act (1985) to curb deficits.
3.Clinton’s Fiscal Expansion – A Classic Vigilante Moment
- Clinton’s early promises of large welfare spending and middle-class tax cuts alarmed markets. Rising Treasury yields prompted a policy shift — including tax hikes and spending cuts under the Omnibus Budget Reconciliation Act of 1993 — alongside Fed rate hikes, which stabilized yields.
4.Eurozone Debt Crisis (2010)
- Greece concealed its true fiscal condition. When real debt-to-GDP exceeded 100%, investors lost confidence, sending 10-year Greek bond yields to 35%. Greece had to turn to the EU and IMF for aid, agreeing to strict austerity in return.
Recommended Articles


