
Dow Jones Industrial Average tumbles on Wednesday, shedding 800 points
- The Dow Jones fell on Wednesday, shedding 800 points at its lowest and slipping below 42,000.
- Investors have pivoted to concerns about the US federal budget which will send US deficits higher, not lower.
- Market concerns that the Trump administration’s bespoke budget won’t actually do anything to fix inflation or US debt issues sent Treasury yields higher, putting downward pressure on equity markets.
The Dow Jones Industrial Average (DJIA) recoiled on Wednesday, tumbling 800 and testing below 42,000 after demand for United States (US) Treasuries declined. Financial markets are showing waning interest and confidence in US debt financing, even with 20-year Treasury bonds offering a yield north of 5% for the first time since October of 2023. The bid-to-cover on 16B worth of 20-year Treasuries fell below its six-month average of 2.57, slipping to 2.46 and sending market sentiment into a brief tailspin.
The US government inches closer to approving US President Donald Trump’s “big, beautiful budget” that will add almost four trillion dollars to the US deficit over the next decade. The deficit-swelling budget comes less than a week after Moody’s downgraded US sovereign debt, citing long-running failures by the US government to reel in government spending or sufficiently increase tax receipts.
A rate cut, a rate cut, my kingdom for a rate cut!
Investor hopes for another rate cut from the Federal Reserve (Fed) continue to get pushed further out this year. According to Fed policymakers, the looming threat that US tariffs could reignite inflation and throw a wrench in US economic growth is limiting their ability to adjust policy rates as they wait for clear data. The Trump administration is barreling towards the end of its own “reciprocal tariffs” suspension deadline, and evidence of ink-on-paper trade deals remains functionally non-existent. With the future of US trade policy muddying the waters, rate traders are now split on whether the Fed will deliver its first quarter-point rate cut in September or October.
Read more stock news: US stock market slips despite Republicans inching closer to major tax cuts
Dow Jones price forecast
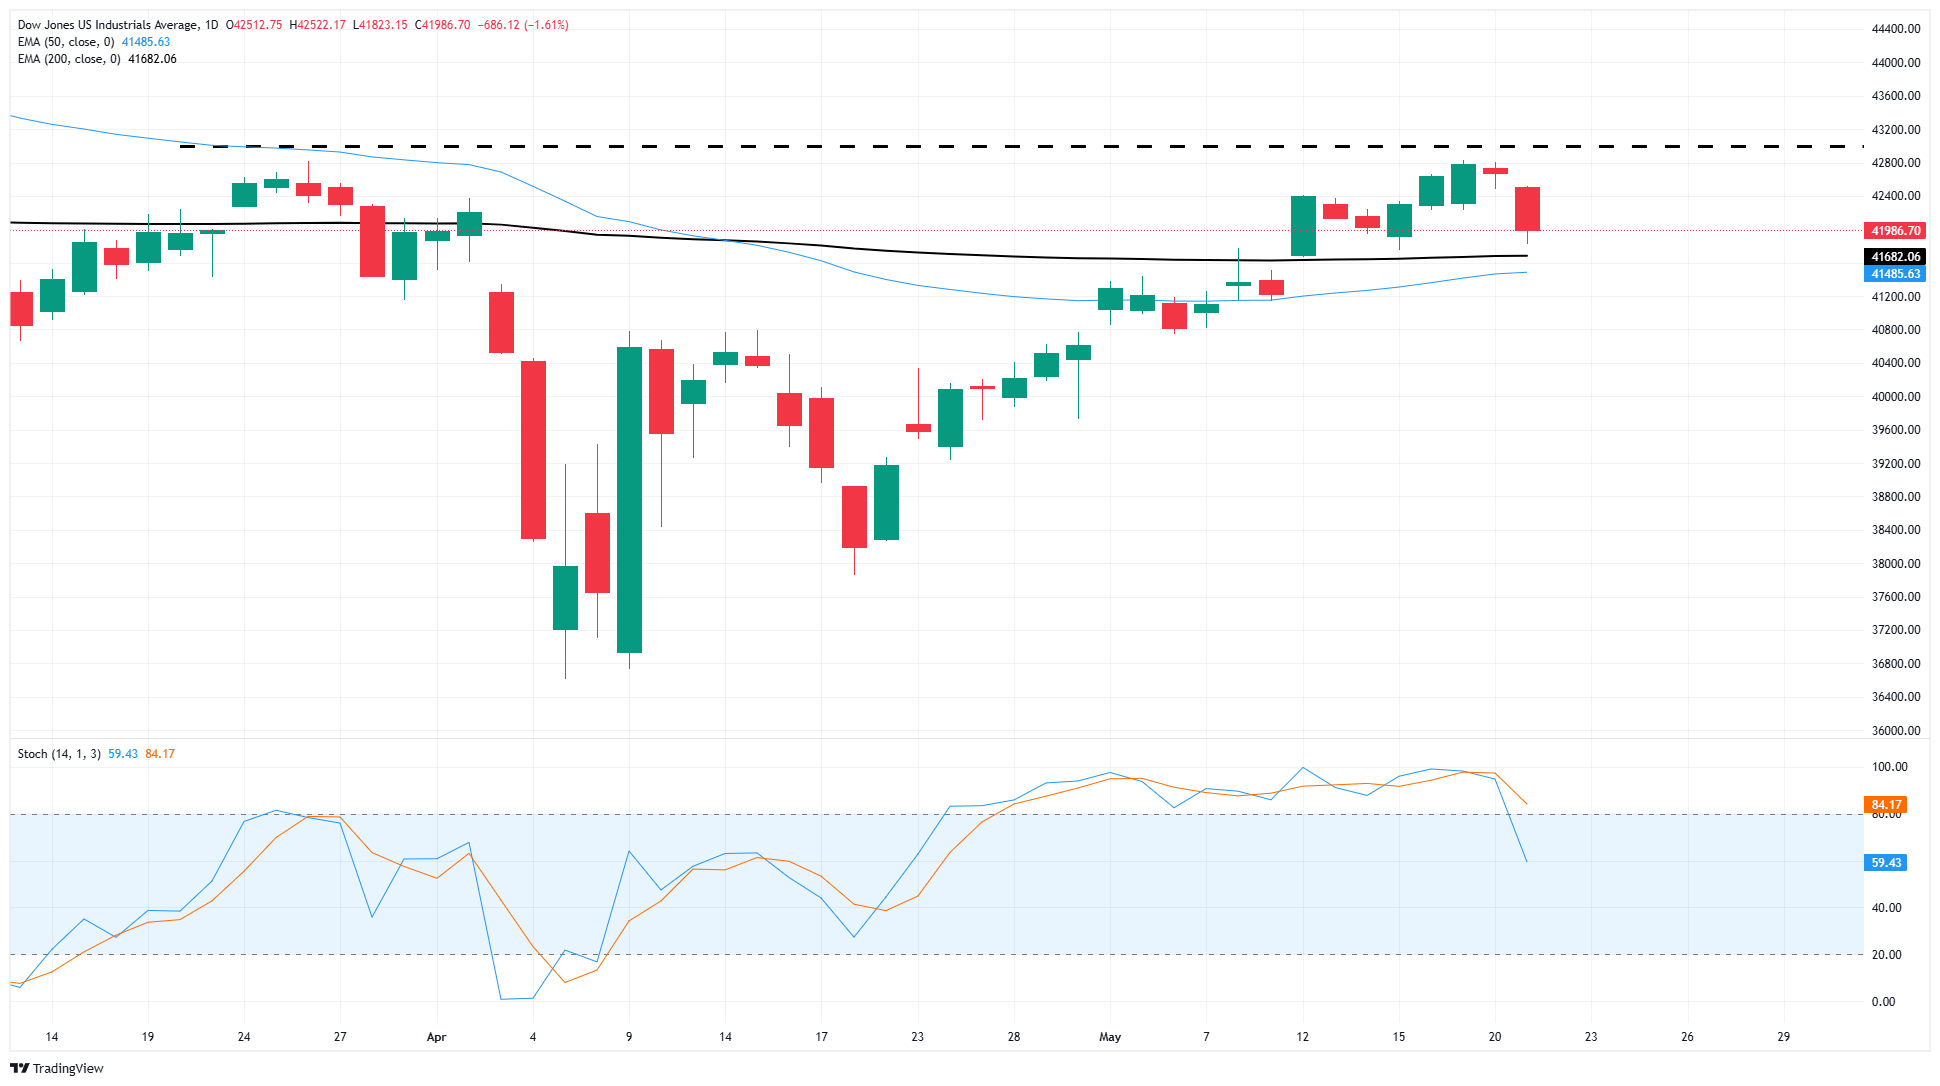
Fundamentals have bled through the chart paper, taking over market dynamics as investors react to headlines about trade and federal budgets. The Dow Jones Industrial Average is still trading above the 200-day Exponential Moving Average (EMA) near 41,570, at least for now. Bullish price action continues to have the wind knocked out of its sails, and buyers have thus far struggled to muscle the major equity index back to the 43,000 handle.
Dow Jones daily chart
Dow Jones FAQs
The Dow Jones Industrial Average, one of the oldest stock market indices in the world, is compiled of the 30 most traded stocks in the US. The index is price-weighted rather than weighted by capitalization. It is calculated by summing the prices of the constituent stocks and dividing them by a factor, currently 0.152. The index was founded by Charles Dow, who also founded the Wall Street Journal. In later years it has been criticized for not being broadly representative enough because it only tracks 30 conglomerates, unlike broader indices such as the S&P 500.
Many different factors drive the Dow Jones Industrial Average (DJIA). The aggregate performance of the component companies revealed in quarterly company earnings reports is the main one. US and global macroeconomic data also contributes as it impacts on investor sentiment. The level of interest rates, set by the Federal Reserve (Fed), also influences the DJIA as it affects the cost of credit, on which many corporations are heavily reliant. Therefore, inflation can be a major driver as well as other metrics which impact the Fed decisions.
Dow Theory is a method for identifying the primary trend of the stock market developed by Charles Dow. A key step is to compare the direction of the Dow Jones Industrial Average (DJIA) and the Dow Jones Transportation Average (DJTA) and only follow trends where both are moving in the same direction. Volume is a confirmatory criteria. The theory uses elements of peak and trough analysis. Dow’s theory posits three trend phases: accumulation, when smart money starts buying or selling; public participation, when the wider public joins in; and distribution, when the smart money exits.
There are a number of ways to trade the DJIA. One is to use ETFs which allow investors to trade the DJIA as a single security, rather than having to buy shares in all 30 constituent companies. A leading example is the SPDR Dow Jones Industrial Average ETF (DIA). DJIA futures contracts enable traders to speculate on the future value of the index and Options provide the right, but not the obligation, to buy or sell the index at a predetermined price in the future. Mutual funds enable investors to buy a share of a diversified portfolio of DJIA stocks thus providing exposure to the overall index.
Recommended Articles


