EUR/USD Price Analysis: Pair holds firm near 1.13 after sharp rise

Source Fxstreet
  • EUR/USD trades near the 1.13 zone on Monday after a sharp intraday rise.
  • The pair maintains a bullish bias despite mixed short-term signals.
  • Key support is clustered below 1.1230, with resistance near 1.1280.

The EUR/USD pair is trading near the 1.13 zone on Monday, reflecting a strong intraday recovery as the market gains momentum after the European session. Despite the sharp upside move, the broader technical outlook presents a mixed picture, with conflicting signals across different timeframes. Shorter-term indicators suggest potential pullbacks, while the longer-term trend remains firmly bullish, providing a cautiously optimistic backdrop for the pair.

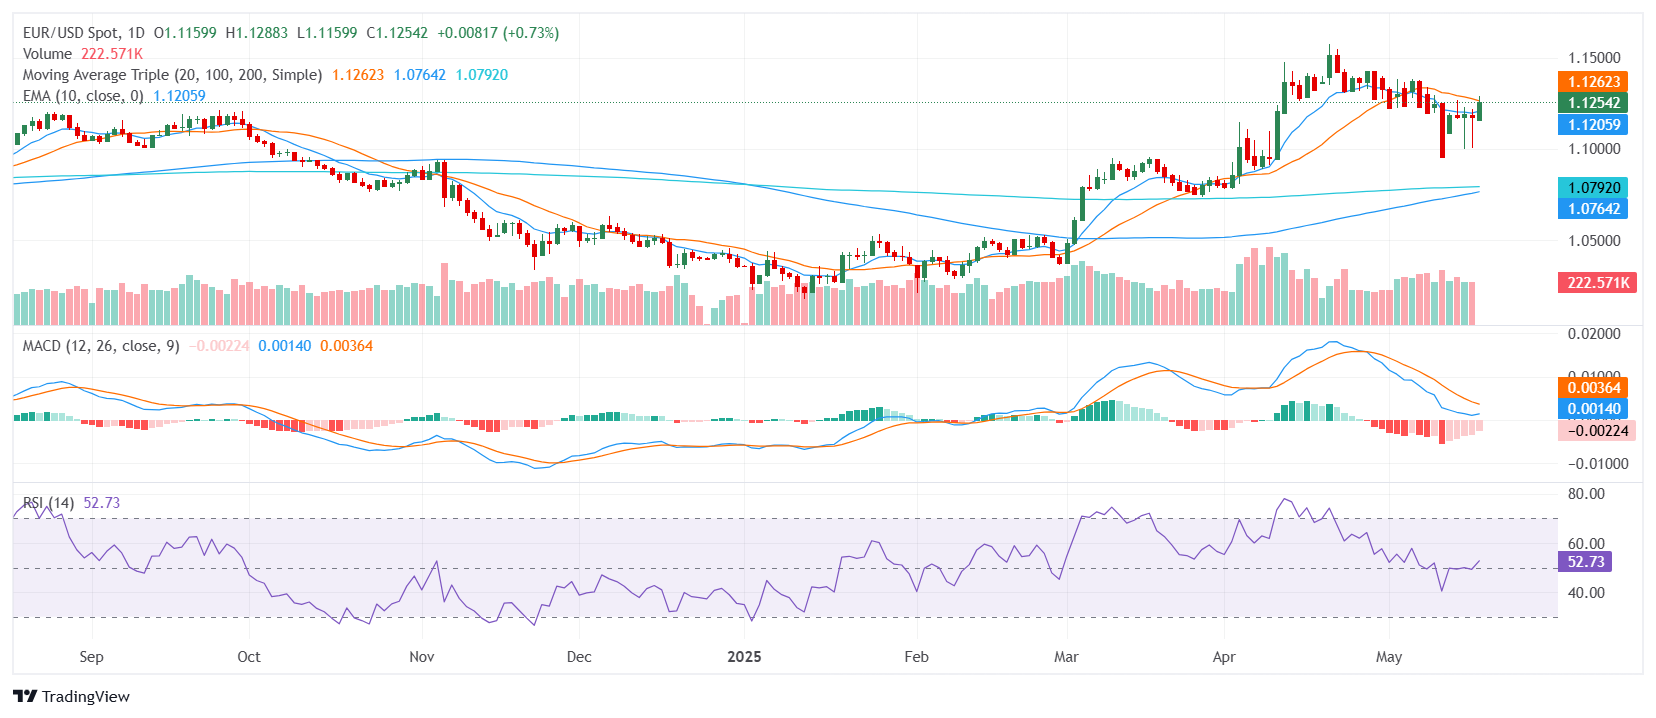
The daily technical setup reflects a complex, but overall positive, outlook. The Relative Strength Index (RSI) is in the 50s, signaling neutral momentum, while the Moving Average Convergence Divergence (MACD) still points to sell pressure, highlighting the potential for near-term consolidation. However, the Average Directional Index (14) in the 20s supports buying pressure, suggesting the pair might sustain its recent gains. The Williams Percent Range (14) and the Commodity Channel Index (20) also indicate neutral momentum, reinforcing the cautious tone.

Moving averages paint a more supportive long-term picture. The 10-day Exponential Moving Average (EMA) and the 10-day Simple Moving Average (SMA) are aligned with the current bullish sentiment, while the 100-day and 200-day SMAs confirm the broader upward bias. In contrast, the 20-day SMA remains in sell territory, acting as a potential headwind for the pair's recovery.

Shifting to the 4-hour timeframe, the outlook remains firmly bullish. The 4-hour MACD signals buy momentum, aligning with the broader daily trend, while the shorter-term 10 and 20-period EMAs and SMAs also indicate sustained buying interest. The Relative Strength Index (RSI) and Average Directional Index (ADI) on the 4-hour chart remain neutral, reflecting the current consolidation phase after the sharp move higher.

Immediate support is seen around 1.1230, with additional levels at 1.1220 and 1.1217. On the upside, resistance is likely to emerge around 1.1280, followed closely by 1.1282 and 1.1284. Broader Fibonacci levels place deeper support in the 1.0400 to 1.0900 range, while resistance extends toward 1.1500, 1.1700, and 1.2000, providing a wider context for potential breakout scenarios.

Daily Chart

Disclaimer: For information purposes only. Past performance is not indicative of future results.
placeholder
Ethereum Price Fails to Break Through — What’s Holding It Back?Ethereum price corrected gains and tested the $2,320 zone. ETH is now struggling and might decline toward the $2,220 support zone. Ethereum started a correction from the $2,580 zone and tested
Author  NewsBTC
15 hours ago
Ethereum price corrected gains and tested the $2,320 zone. ETH is now struggling and might decline toward the $2,220 support zone. Ethereum started a correction from the $2,580 zone and tested
placeholder
Top 3 Price Prediction: Bitcoin, Ethereum, Ripple: BTC, ETH and XRP breakout or fakeout? Momentum tools flash weaknessBitcoin (BTC) trades slightly lower on Monday after breaking above key resistance at $105,000 on Sunday, raising concerns of a potential bull trap.
Author  FXStreet
15 hours ago
Bitcoin (BTC) trades slightly lower on Monday after breaking above key resistance at $105,000 on Sunday, raising concerns of a potential bull trap.
placeholder
Gold price struggles to capitalize on modest intraday gains to $3,250 areaGold price (XAU/USD) attracts buyers during the Asian session on Monday as a surprise downgrade of the US government's credit rating tempers investors' appetite for riskier assets and boosts demand for traditional safe-haven assets.
Author  FXStreet
15 hours ago
Gold price (XAU/USD) attracts buyers during the Asian session on Monday as a surprise downgrade of the US government's credit rating tempers investors' appetite for riskier assets and boosts demand for traditional safe-haven assets.
placeholder
XRP Price Struggles to Hold Ground — Breakdown or Breather?XRP price started a downside correction below the $2.480 zone. The price is now consolidating and might extend losses below the $2.320 support zone. XRP price started a fresh decline below the $2.520
Author  NewsBTC
15 hours ago
XRP price started a downside correction below the $2.480 zone. The price is now consolidating and might extend losses below the $2.320 support zone. XRP price started a fresh decline below the $2.520
placeholder
EUR/USD Price Forecast: Seems vulnerable below 1.1200, 200-period SMA on H4 holds the keyThe EUR/USD pair ticks higher at the start of a new week amid a softer US Dollar (USD), though it lacks bullish conviction and remains below the 1.1200 round figure through the Asian session.
Author  FXStreet
15 hours ago
The EUR/USD pair ticks higher at the start of a new week amid a softer US Dollar (USD), though it lacks bullish conviction and remains below the 1.1200 round figure through the Asian session.
Related Instrument
goTop
quote