
GBP/USD crashes on US-China trade truce boosting US Dollar
- US-China agree on 90-day tariff rollback; US cuts to 30%, China to 10%, easing global recession fears.
- Dollar rallies on deal optimism; DXY up over 1% to highest since April 10.
- UK traders brace for busy week with jobs, GDP, and manufacturing data as BoE officials strike cautious tone.
The Pound Sterling collapsed by over 0.71% or 90 pips on Monday, following developments over the weekend that boosted the US Dollar. News of the US-China de-escalation of the trade war weighed on Sterling, which plummeted from around 1.3298. At the time of writing, the GBP/USD trades at 1.3207.
GBP/USD plunges over 0.71% after tariff de-escalation boosts risk sentiment and DXY surges past 101.50
The US and China agreed to reduce tariffs, with the US reducing its duties from 115% to 30% on Chinese goods, while Beijing slashed its duties to 10% on US imports. The deal is a 90-day pause, effective as of May 14.
Investors welcomed the news as Wall Street opened in the green amid speculation that an agreement between Washington and Beijing might prevent the global economy from tipping into a recession. Meanwhile, traders are eyeing the release of US Consumer Price Index (CPI) figures alongside the release of inflation data on the producer front and Retail Sales.
In the meantime, the US Dollar Index (DXY), which tracks the performance of the US dollar against six other major currencies, is up more than 1% at 101.54, its highest level since April 10.
The UK economic docket will feature employment data on Tuesday, followed by GDP and manufacturing data on Thursday. Meanwhile, Bank of England (BoE) officials are making headlines.
The Bank of England’s Megan Green and Deputy Governor Clare Lombardelli expressed that Inflation is moving in the right direction. Still, Lombardelli warned that she remains cautious and would wait for evidence of a slowdown.
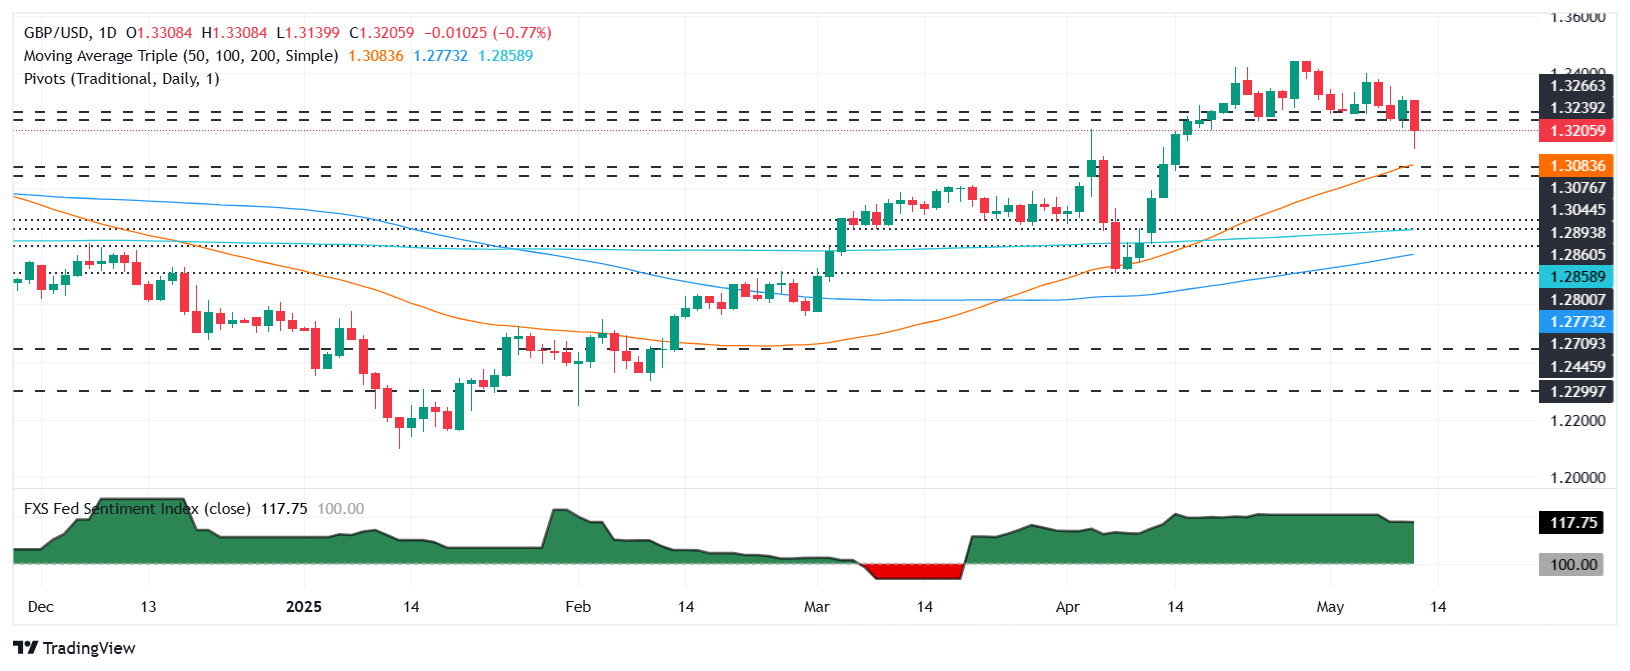
GBP/USD Price Chart: Technical outlook
The GBP/USD rally paused on upbeat news from the US, which sent the pair aiming toward the 50-day Simple Moving Average (SMA) of 1.3080, but sellers lacked the strength to clear 1.3200 and subsequent support levels at 1.3150 and the 1.3100 figure.
A daily close below the May 9 swing low of 1.3211 could pave the way for a red week for the currency, but catalysts could keep the GBP/USD within the current level if data maintains the status quo.
On the other hand, if the GBP/USD rises above 1.3250, the next resistance level would be the 20-day Simple Moving Average (SMA) at 1.3308. A breach of the latter will exposed the May 6 high at 1.3402.
British Pound PRICE Today
The table below shows the percentage change of British Pound (GBP) against listed major currencies today. British Pound was the strongest against the Japanese Yen.
| USD | EUR | GBP | JPY | CAD | AUD | NZD | CHF | |
|---|---|---|---|---|---|---|---|---|
| USD | 1.19% | 0.77% | 1.26% | 0.71% | 0.62% | 0.97% | 0.99% | |
| EUR | -1.19% | -0.29% | 0.63% | 0.00% | 0.06% | 0.26% | 0.26% | |
| GBP | -0.77% | 0.29% | 1.10% | 0.29% | 0.36% | 0.47% | 0.55% | |
| JPY | -1.26% | -0.63% | -1.10% | -0.57% | -1.27% | -1.15% | -0.53% | |
| CAD | -0.71% | -0.00% | -0.29% | 0.57% | 0.18% | 0.25% | 0.25% | |
| AUD | -0.62% | -0.06% | -0.36% | 1.27% | -0.18% | 0.10% | 0.17% | |
| NZD | -0.97% | -0.26% | -0.47% | 1.15% | -0.25% | -0.10% | -0.02% | |
| CHF | -0.99% | -0.26% | -0.55% | 0.53% | -0.25% | -0.17% | 0.02% |
The heat map shows percentage changes of major currencies against each other. The base currency is picked from the left column, while the quote currency is picked from the top row. For example, if you pick the British Pound from the left column and move along the horizontal line to the US Dollar, the percentage change displayed in the box will represent GBP (base)/USD (quote).
Recommended Articles


