
Crypto Today: Bitcoin, Ethereum, XRP sell-off persists amid low institutional and retail demand
- Bitcoin holds above $97,000, weighted down by a widespread bearish wave amid muted institutional and retail interest.
- Ethereum declines for five consecutive days, as ETF outflows persist.
- XRP derivatives market steadies, with Open Interest at $3.78 billion, highlighting low retail demand.
Bitcoin (BTC) is trading above $97,000 at the time of writing on Friday amid a sticky bearish wave in the broader cryptocurrency market. Both institutional and retail demand remain muted, making it difficult for BTC to sustain recovery.
The sell-off extends to altcoins, with Ethereum (ETH) and Ripple (XRP) hovering below $3,200 and $2.30, respectively. A 5.4% drop in the total market capitalization to $3.36 trillion over the last 24 hours underpins the steady risk-off sentiment.
Data spotlight: Bitcoin, Ethereum institutional interest fades
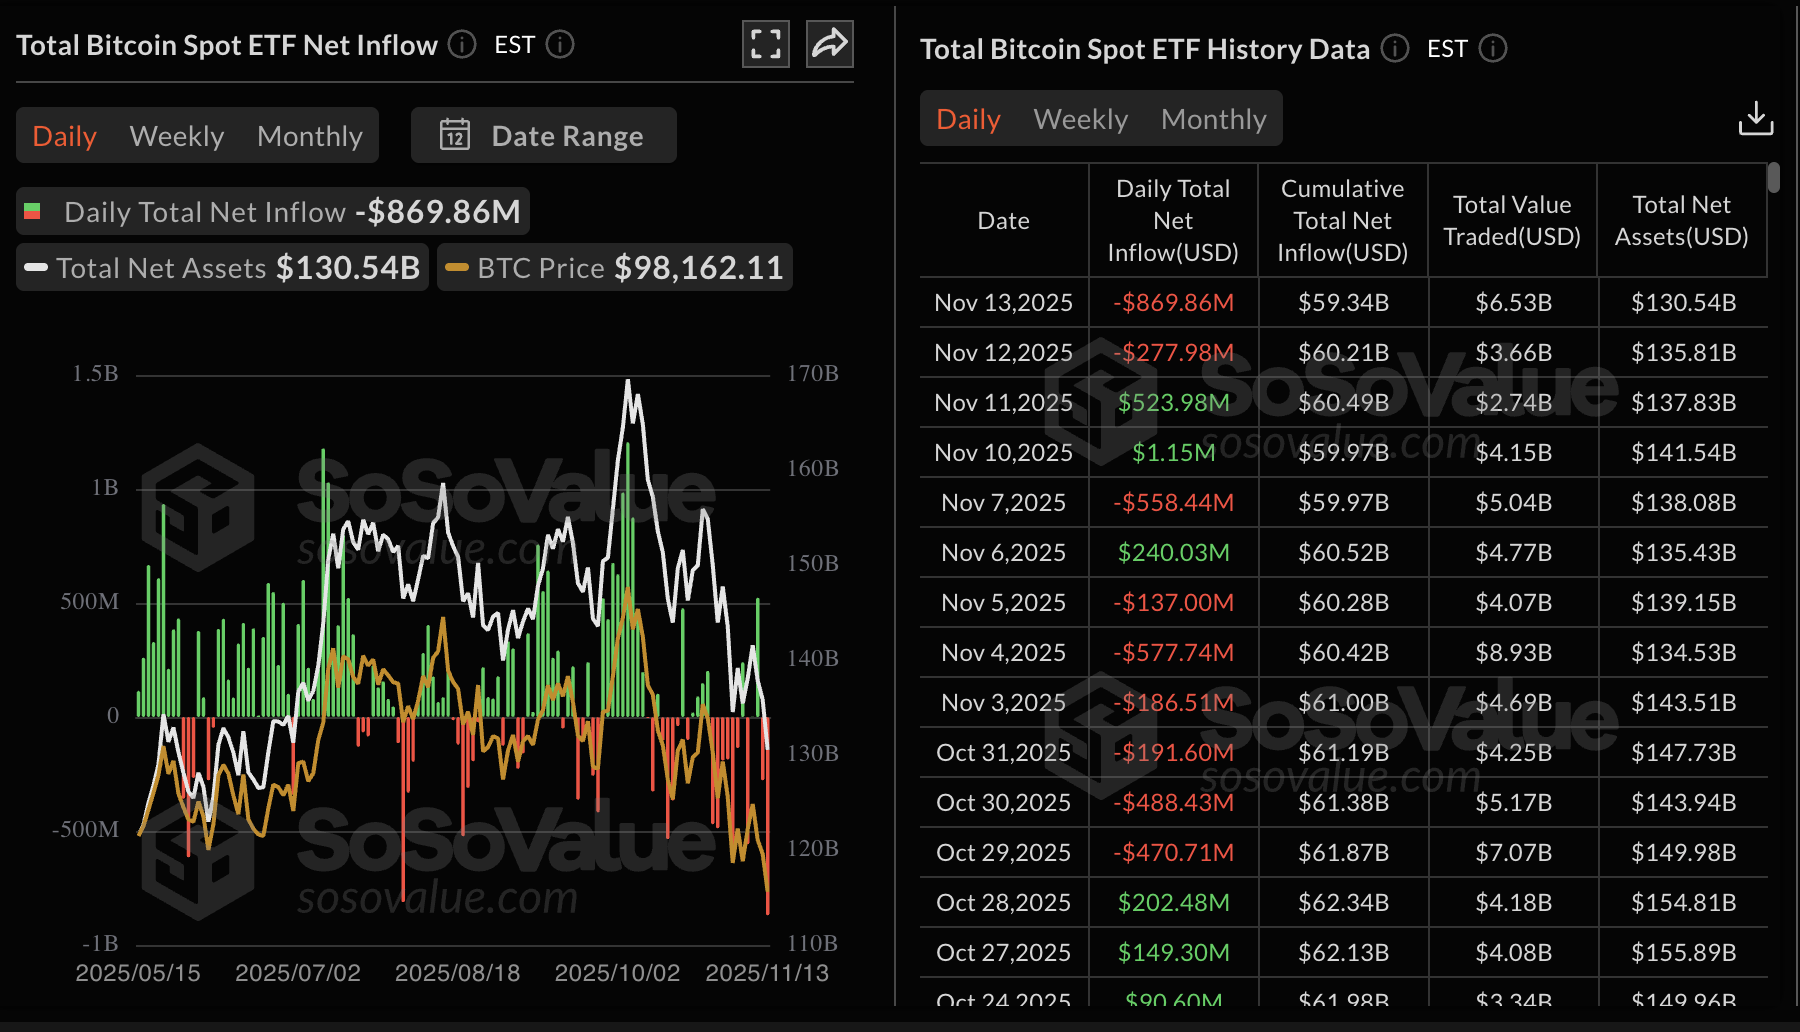
Bitcoin is facing a major exodus of institutional investors, with Exchange Traded Funds (ETFs) extending outflows. SoSoValue data shows that US-listed BTC spot ETFs experienced approximately $870 million in outflows on Thursday, the highest since October 7.
Grayscale's GBTC led with $318 million in outflows, followed by BlackRock's IBIT with $257 million and Fidelity's FBTC with nearly $200 million. The cumulative total inflow stands at $59.34 billion with net assets of $130.54 billion.
ETFs have become a key measure of interest in Bitcoin and the broader cryptocurrency market. Hence, the steady outflows, especially in the fourth quarter, paint a grim picture for the market.
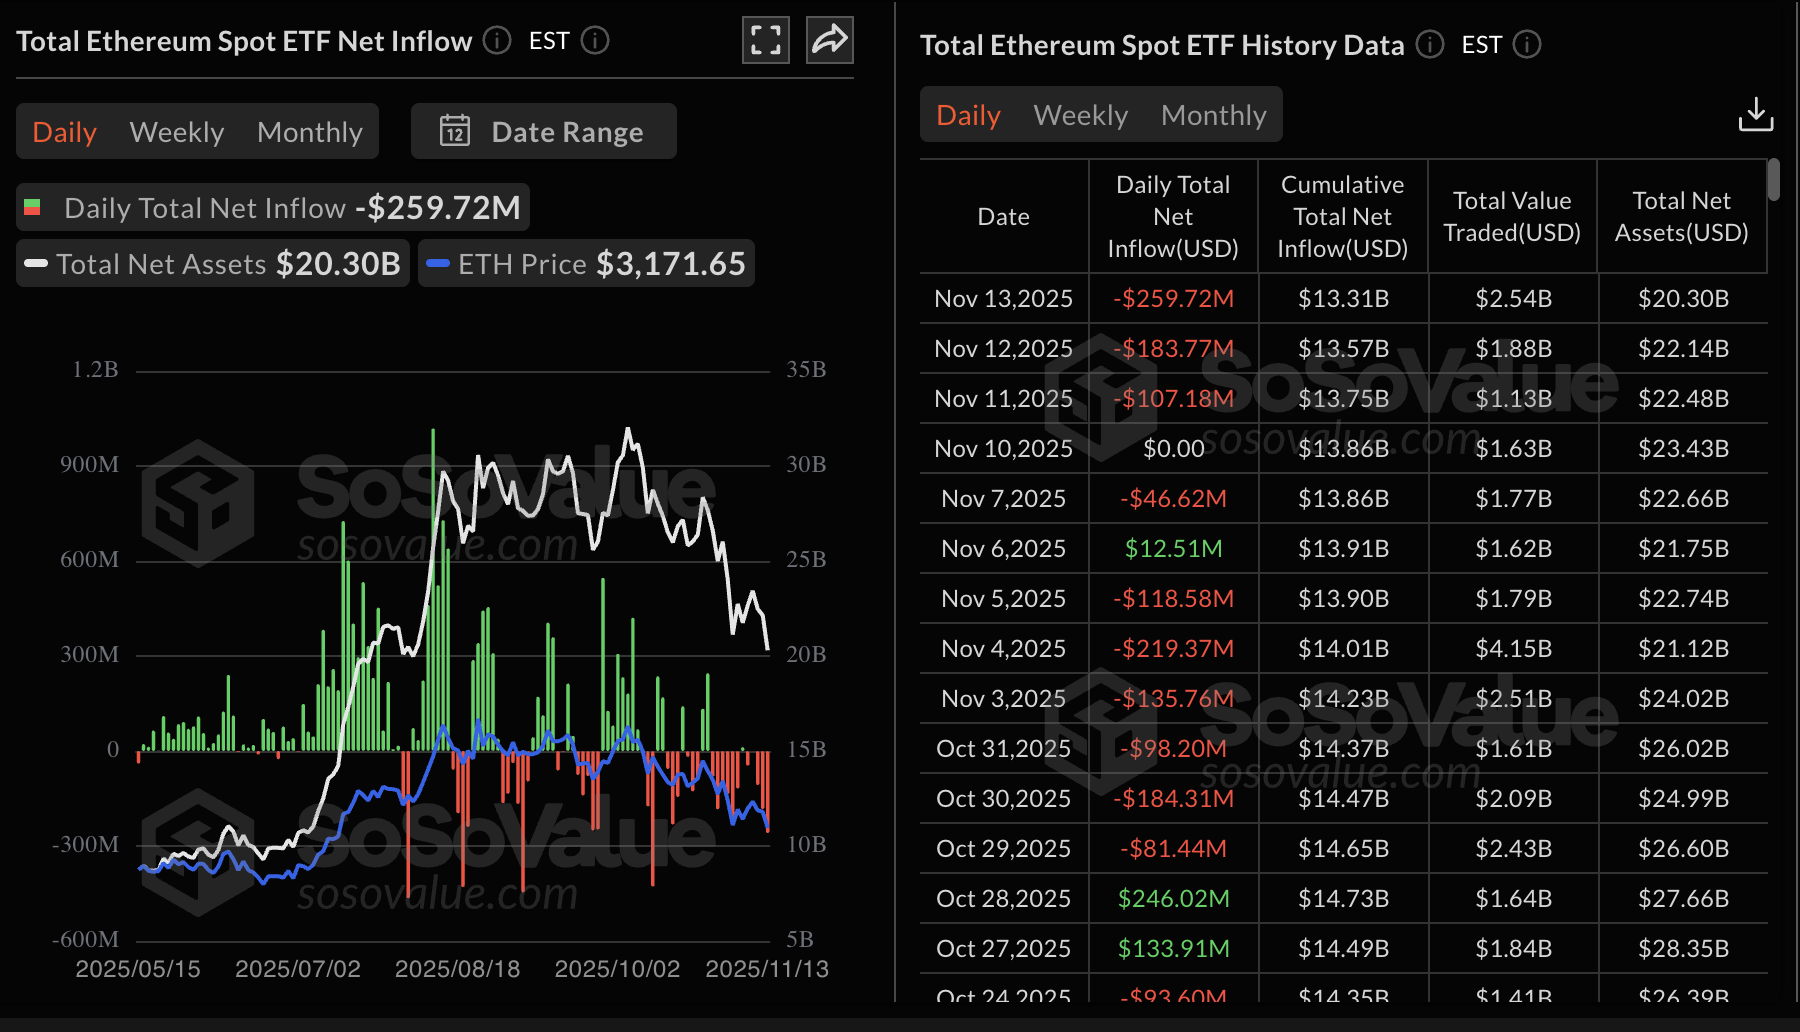
Ethereum ETFs listed in the US are also on the back foot, with nearly $260 million in outflows, recorded on Thursday. The last time ETH ETFs experienced inflows was on November 6 with $12.51 million. SoSoValue data shows a cumulative inflow of $13.31 billion and net assets of $20.30 billion.
Meanwhile, retail demand for XRP has not recovered since mid-October, characterised by a weak derivatives market. CoinGlass data shows the futures Open Interest (OI) averaging $3.78 billion on Friday, slightly up from $3.67 the previous day but down from $4.17 billion posted on November 1.
A steady increase in OI is required to support XRP's short-term recovery, indicating that investors have confidence in the token and the ecosystem and are willing to increase their risk exposure.
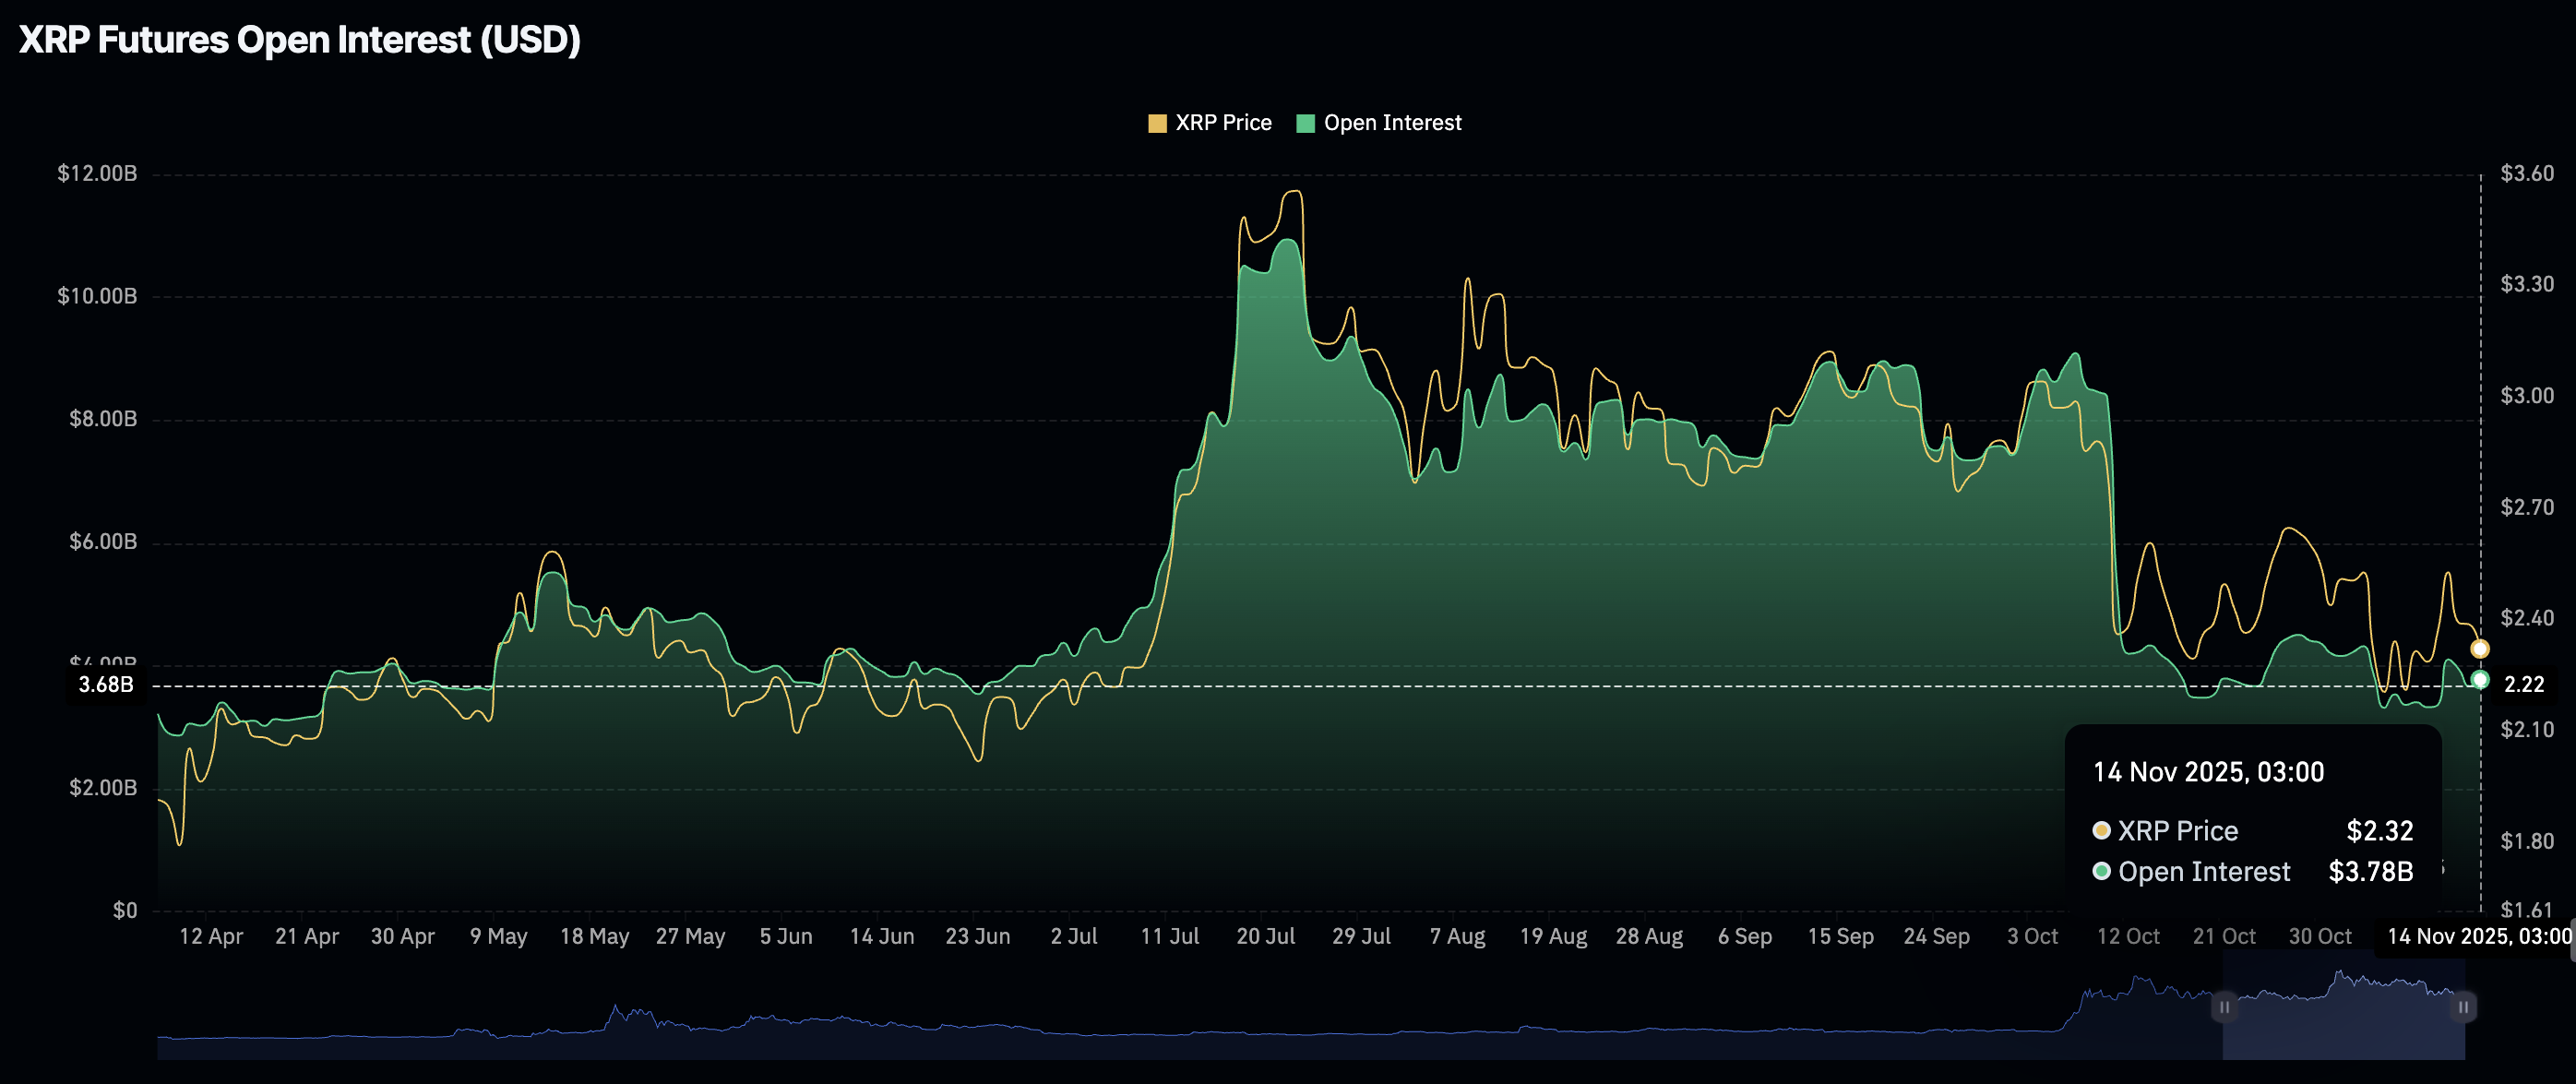
Chart of the day: Bitcoin extends decline as bears tighten grip
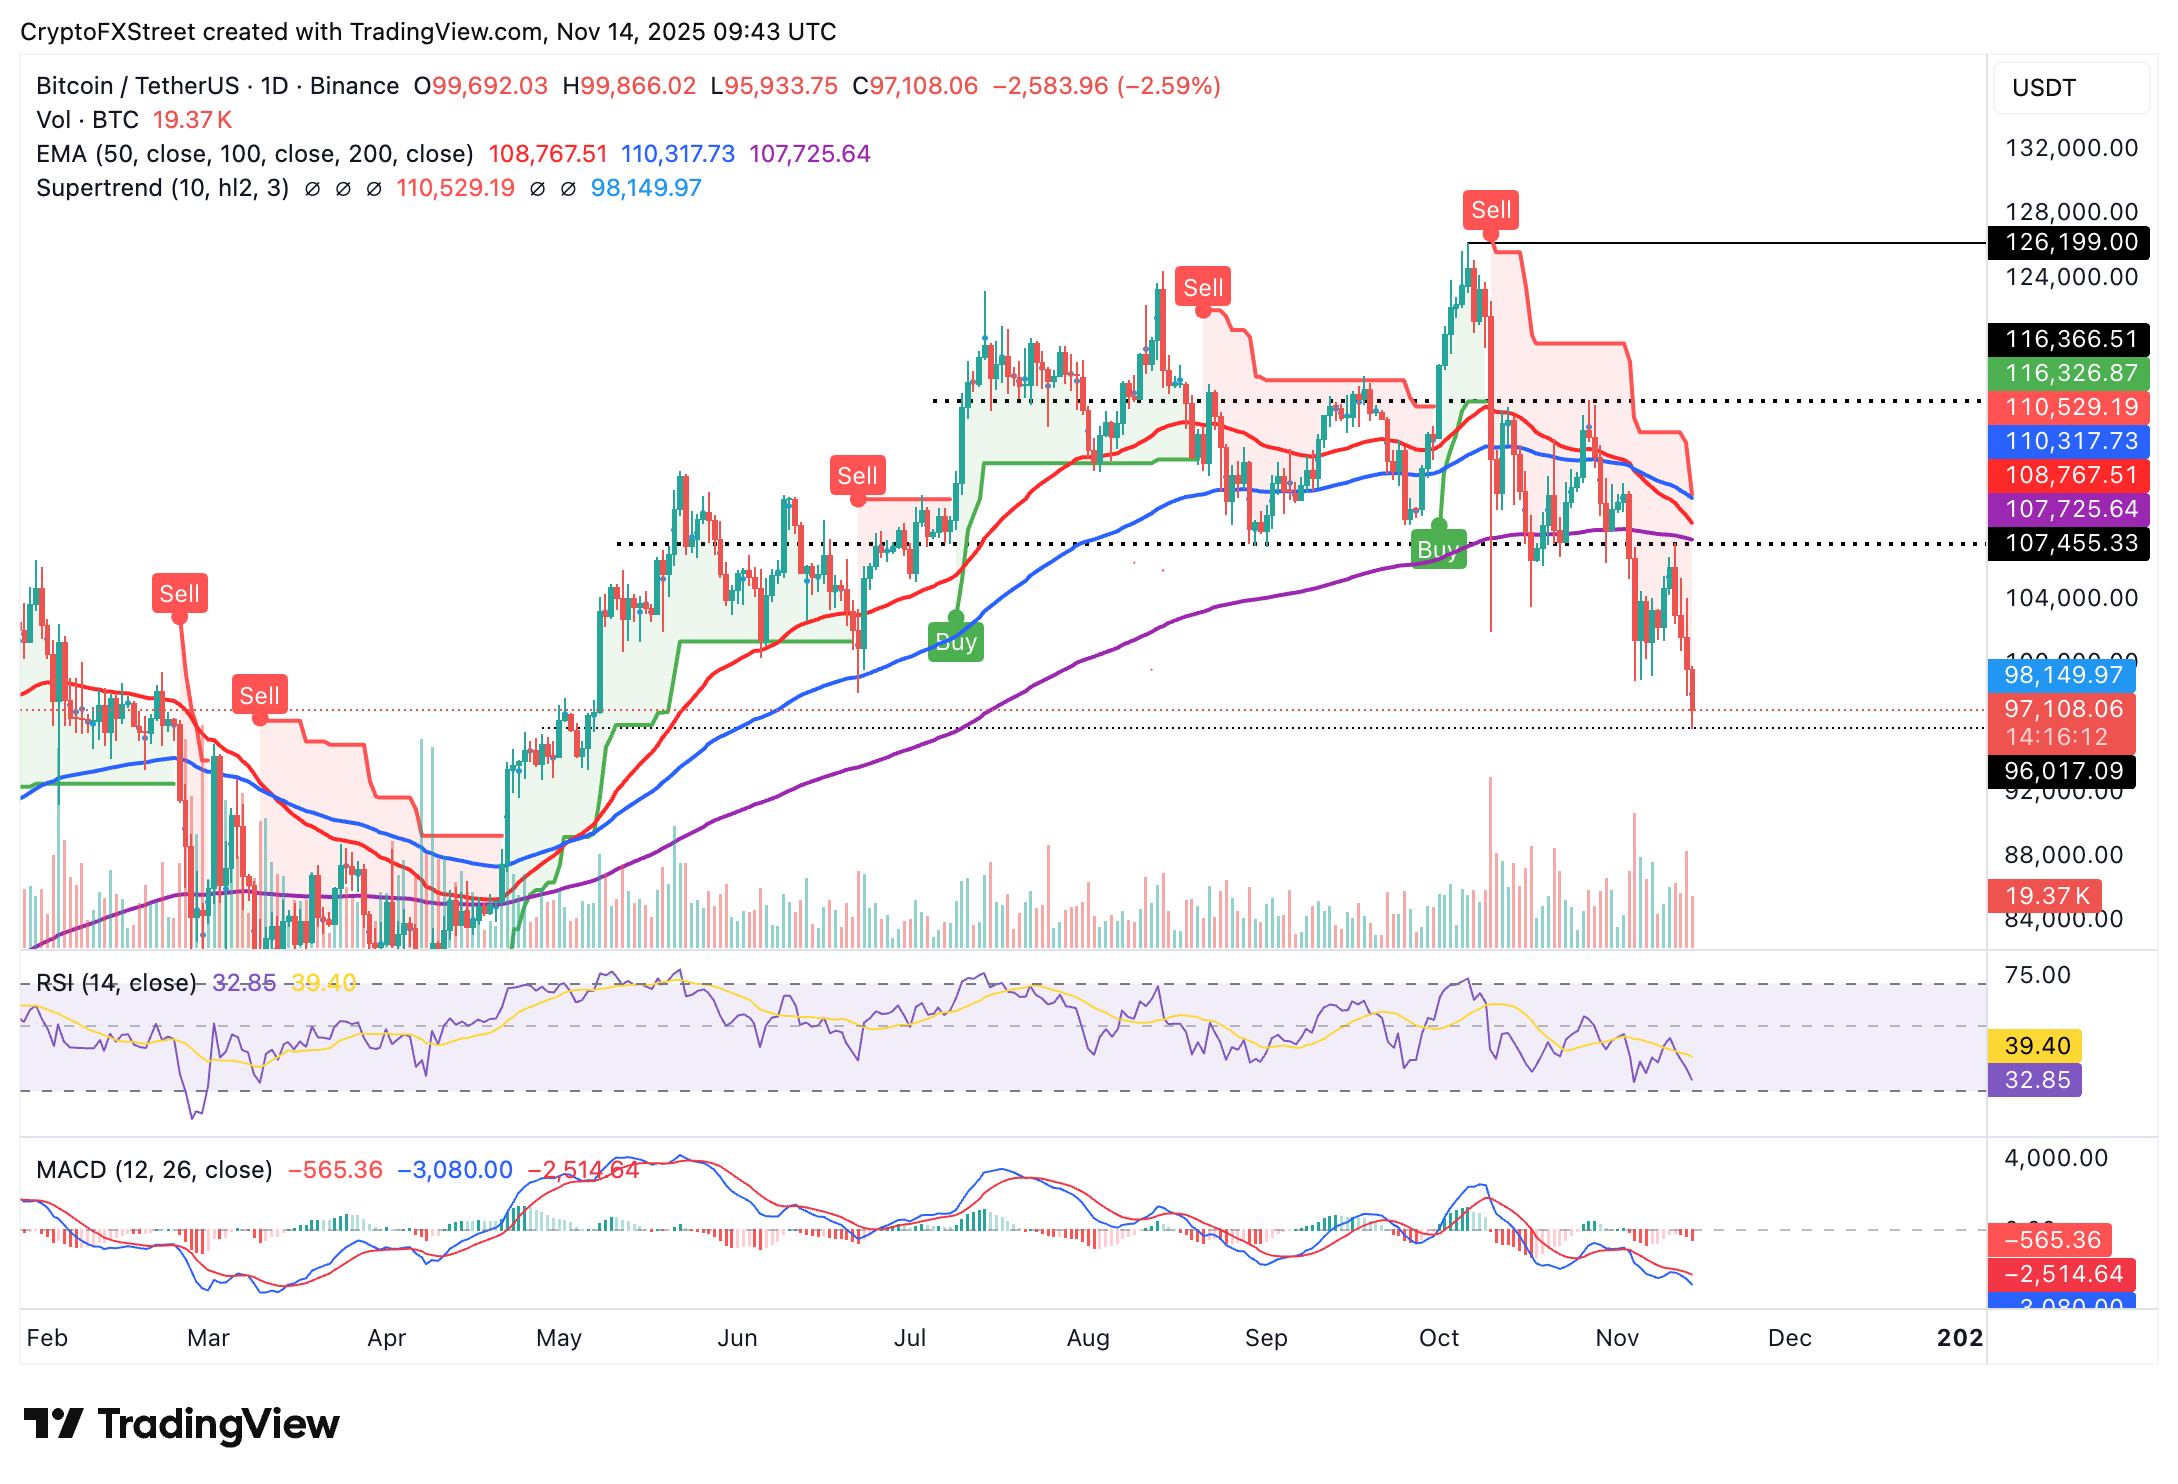
Bitcoin is trading marginally above $97,000 at the time of writing on Friday, after volatility surged, triggering a sell-off below $100,000 on Thursday. A weak technical structure, coupled with macroeconomic uncertainty and a lack of key price catalysts, ate some of the factors weighing Bitcoin down.
The 50-day Exponential Moving Average (EMA) crossed below the 100-day EMA on November 4, forming a Death Cross pattern. This pattern underlines the persistent bearish sentiment, increasing the odds of an extended downtrend.
The Relative Strength Index (RSI) has declined to 32 on the daily chart, indicating that bearish momentum is intensifying. A sell signal from the Moving Average Convergence Divergence (MACD) indicator since November 3 encourages investors to reduce their risk exposure, adding to selling pressure. The intraday low at $95,933 serves as the immediate support. If broken, the down leg could target lower lows towards $90,000.
Altcoins update: Ethereum, XRP slide amid high volatility
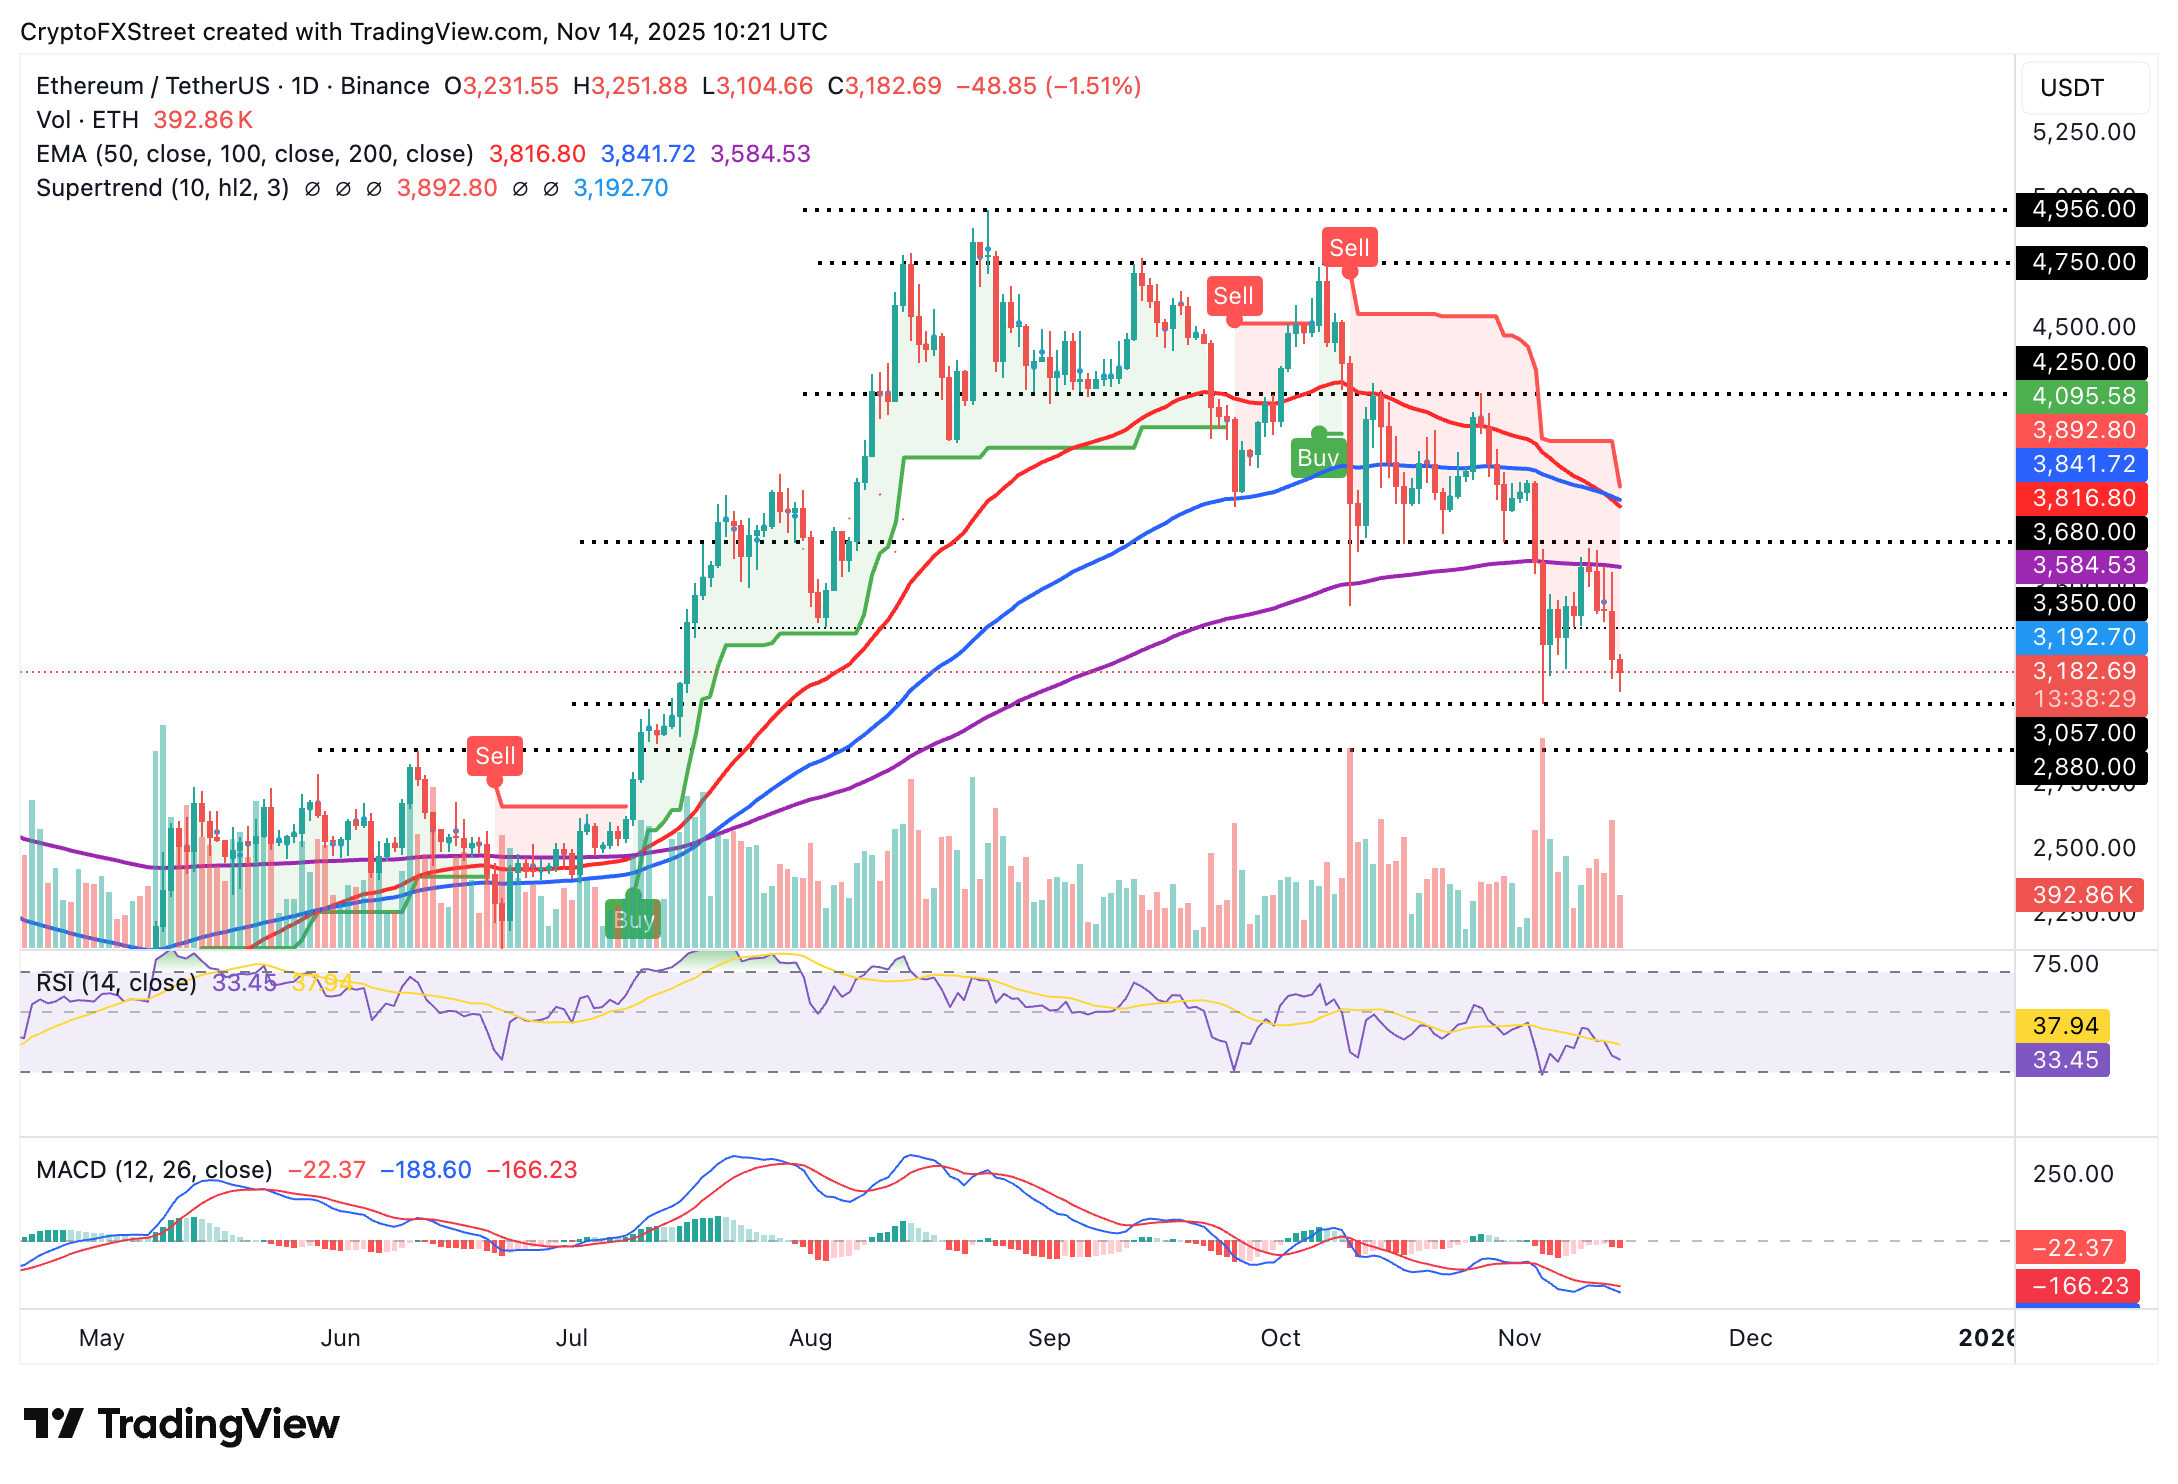
Ethereum is trading below key moving averages, including the 200-day EMA at $3,584, the 50-day EMA at $3,816 and the 100-day EMA at $3,841 at the time of writing on Friday, weighed down by potential profit-taking and reduced risk-on sentiment.
The RSI at 33 on the daily chart aims for oversold territory, indicating that bearish momentum is increasing. If it closes below 30, Ethereum may extend its down leg toward the next support at $3,057, last tested on November 4.
Investors are likely to remain risk-averse, given that the MACD indicator has maintained a sell signal since November 3.
As for XRP, bears have the upper hand, supported by a weak technical structure and negative sentiment in the larger crypto market. XRP is trading at around $2.28 at the time of writing on Friday.
The path of least resistance remains downwards, underpinned by a down-trending RSI at 42 on the daily chart. Lower RSI readings suggest that bearish momentum is building, increasing the odds of a steady downtrend in the XRP price.
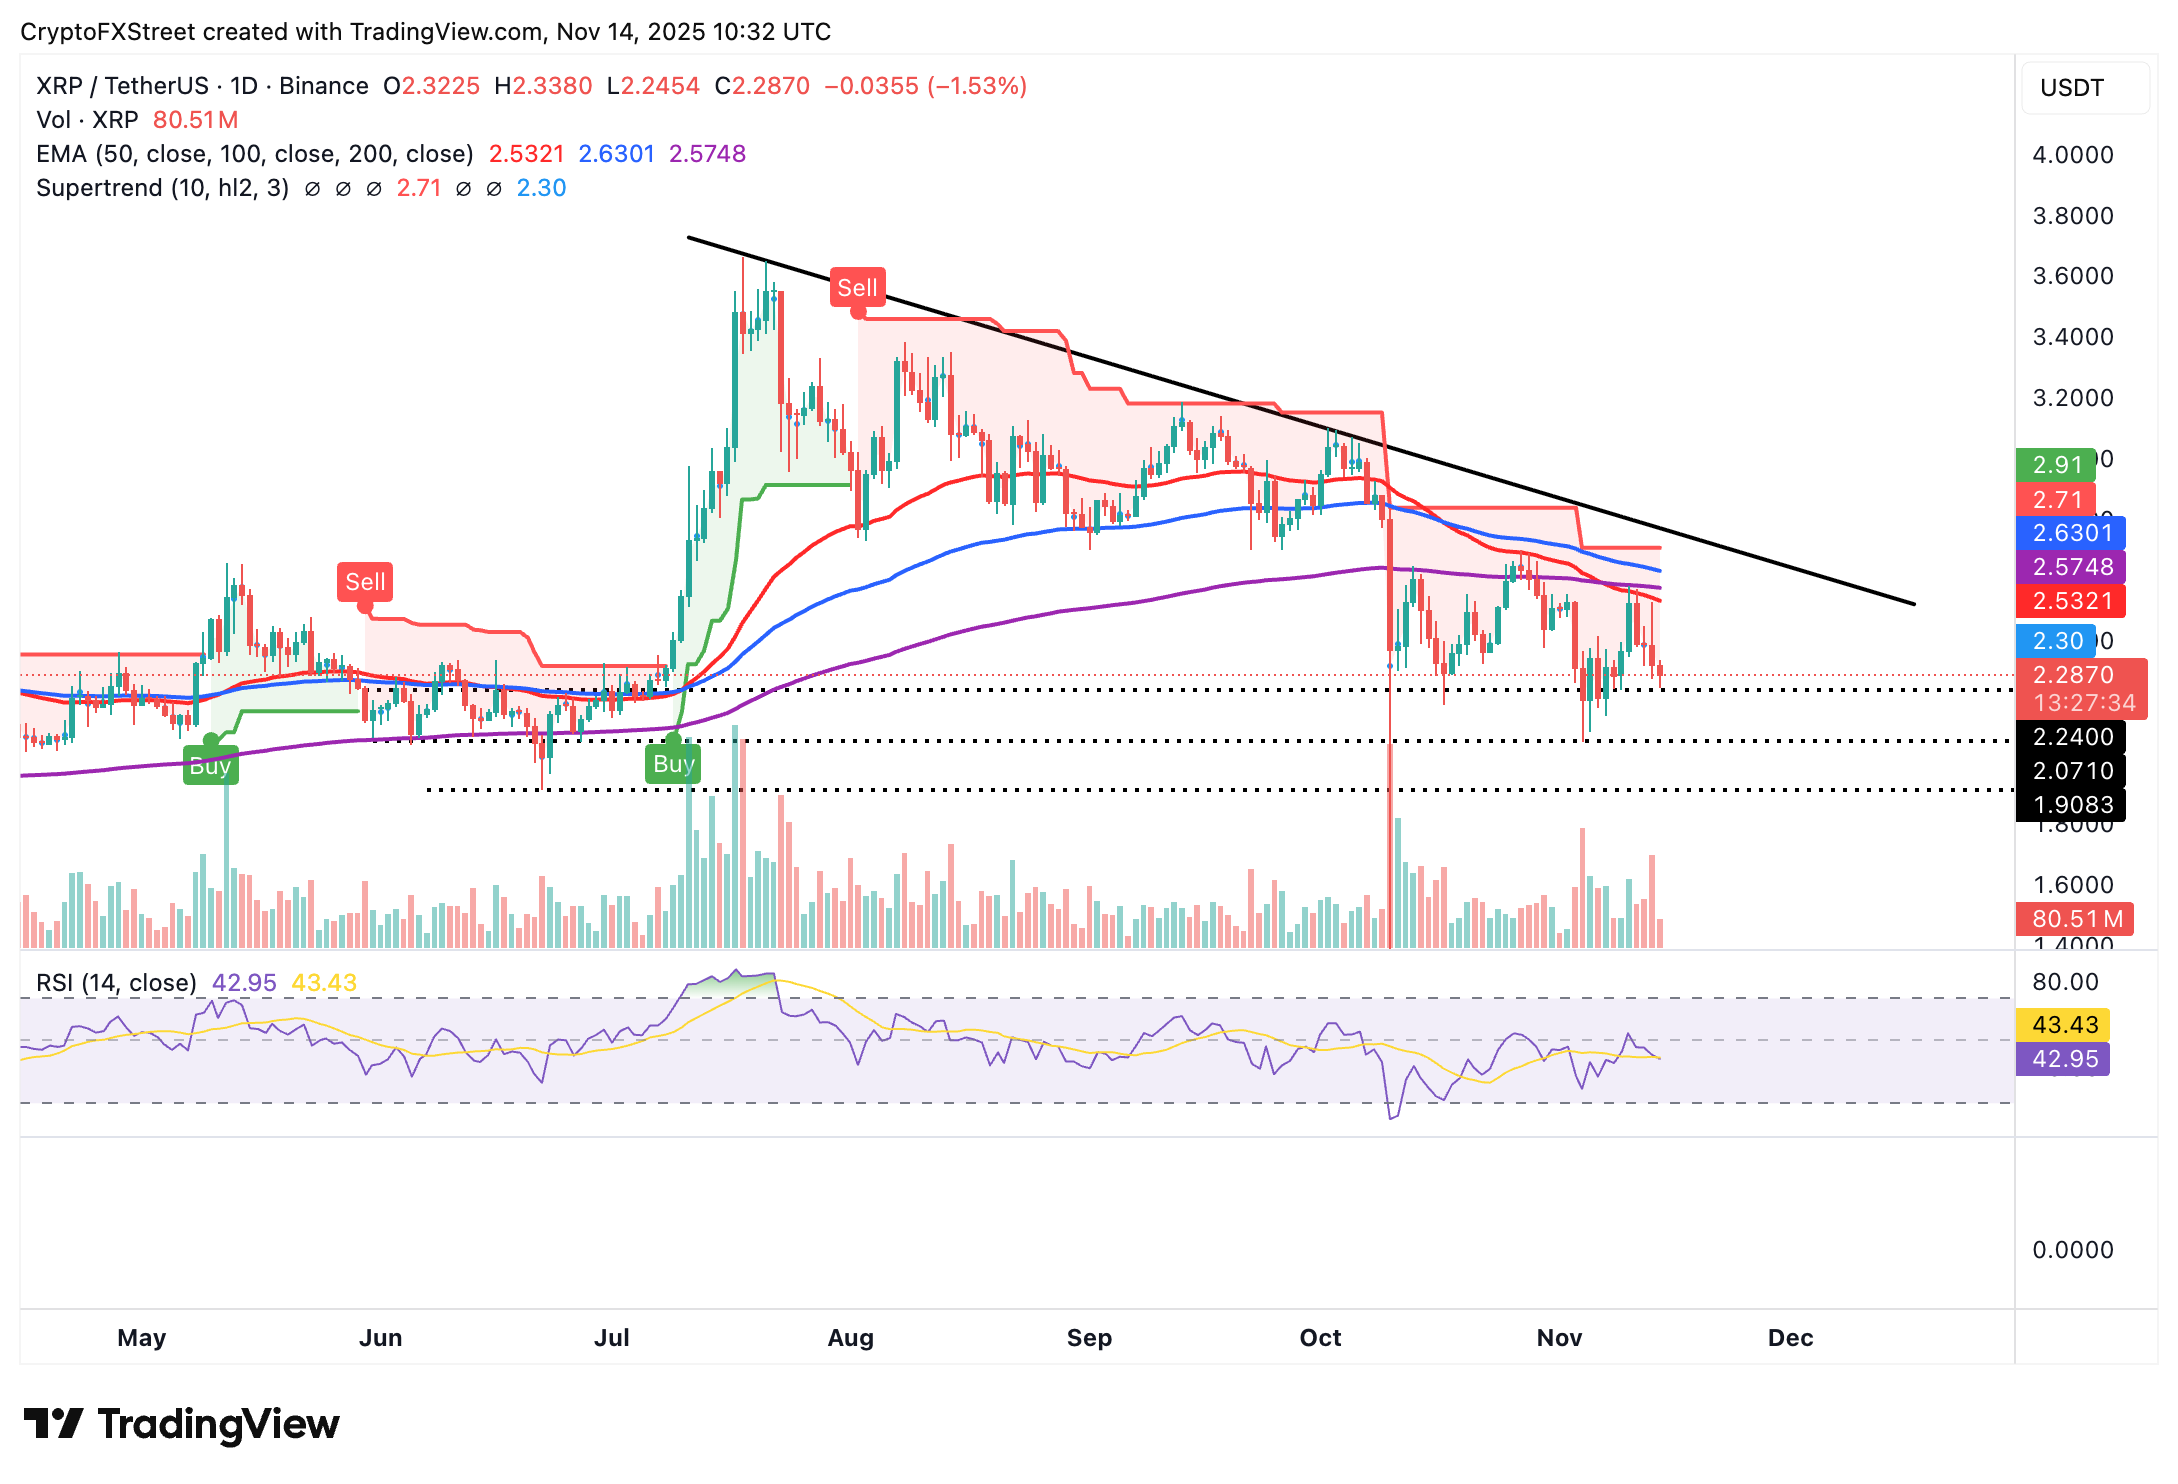
Immediate support at $2.30 prevents XRP from extending its decline to $2.07, an area previously tested on November 4. If the downtrend persists, the next demand zone lies at $1.90, tested in June.
Crypto ETF FAQs
An Exchange-Traded Fund (ETF) is an investment vehicle or an index that tracks the price of an underlying asset. ETFs can not only track a single asset, but a group of assets and sectors. For example, a Bitcoin ETF tracks Bitcoin’s price. ETF is a tool used by investors to gain exposure to a certain asset.
Yes. The first Bitcoin futures ETF in the US was approved by the US Securities & Exchange Commission in October 2021. A total of seven Bitcoin futures ETFs have been approved, with more than 20 still waiting for the regulator’s permission. The SEC says that the cryptocurrency industry is new and subject to manipulation, which is why it has been delaying crypto-related futures ETFs for the last few years.
Yes. The SEC approved in January 2024 the listing and trading of several Bitcoin spot Exchange-Traded Funds, opening the door to institutional capital and mainstream investors to trade the main crypto currency. The decision was hailed by the industry as a game changer.
The main advantage of crypto ETFs is the possibility of gaining exposure to a cryptocurrency without ownership, reducing the risk and cost of holding the asset. Other pros are a lower learning curve and higher security for investors since ETFs take charge of securing the underlying asset holdings. As for the main drawbacks, the main one is that as an investor you can’t have direct ownership of the asset, or, as they say in crypto, “not your keys, not your coins.” Other disadvantages are higher costs associated with holding crypto since ETFs charge fees for active management. Finally, even though investing in ETFs reduces the risk of holding an asset, price swings in the underlying cryptocurrency are likely to be reflected in the investment vehicle too.
추천 기사


