

"Trumpflation" Is Roiling Wall Street -- and It May Not Be a Short-Term Issue as the President Suggests
Key Points
Although the Dow Jones Industrial Average, S&P 500, and Nasdaq Composite all reached new highs in 2026, a rapid rise in inflation is beginning to take its toll.
History suggests that Trump-induced inflation will get worse before it has any chance of getting better.
A historically hawkish Fed chair, coupled with soaring inflation and a pricey stock market, is a dangerous combination.
- 10 stocks we like better than S&P 500 Index ›
It's been a banner year for Wall Street. The ageless Dow Jones Industrial Average (DJINDICES: ^DJI), benchmark S&P 500 (SNPINDEX: ^GSPC), and technology-driven Nasdaq Composite (NASDAQINDEX: ^IXIC) have all reached record highs on the back of the artificial intelligence (AI) revolution and initial public offering mania.
But it's also been quite the year for the U.S. inflation rate, which has effectively hit a three-year high and has begun creating turbulence for Wall Street's major stock indexes. Two concurrent price shocks are taking their toll, both of which have one origin: decisions made by President Donald Trump.
Will AI create the world's first trillionaire? Our team just released a report on the one little-known company, called an "Indispensable Monopoly" providing the critical technology Nvidia and Intel both need. Continue »

President Trump delivering remarks. Image source: Official White House Photo by Joyce N. Boghosian.
While the president has been adamant that pricing pressures on consumers will be short-lived, history offers another take about "Trumpflation" -- and it's not going to please a historically pricey stock market that's been on edge about rising prices over the last few weeks.
Trumpflation is likely to get worse before it has any chance of getting better
To set the record straight, some level of inflation is normal and healthy for the U.S. economy. The Federal Reserve's long-term inflation target of 2% has often been considered the gold standard.
But over the last 13 months, two decisions made by Donald Trump have provided a tailwind, lifting the trailing 12-month (TTM) inflation rate to 3.8% in April. The term "Trumpflation" refers specifically to how these decisions have subsequently affected prices.
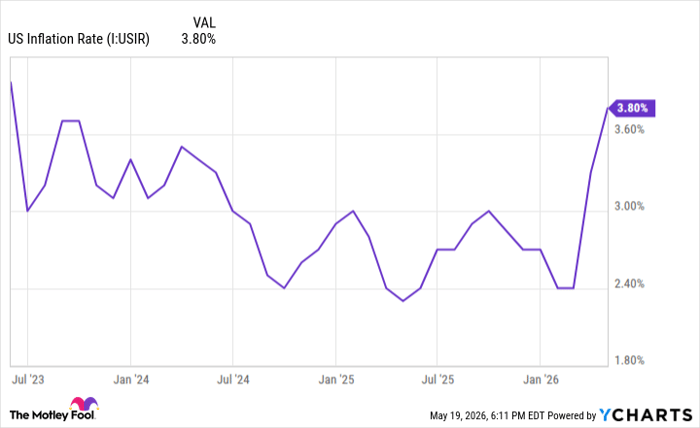
US Inflation Rate data by YCharts.
The first of two price shocks began in early April 2025, when President Trump unveiled his tariff and trade policy. Adding duties on unfinished imported goods (referred to as input tariffs), such as steel, often led to higher domestic production costs that were subsequently passed on to consumers.
Now-former Fed Chair Jerome Powell typically cited the price stickiness of Trump's tariffs on the goods sector when discussing why inflation remained elevated with reporters following Federal Open Market Committee (FOMC) meetings. Though the U.S. Supreme Court invalidated the bulk of the president's tariffs in February 2026, new tariffs instituted by Trump after this ruling continue to affect prices.
The second concurrent price shock, and the one that's really ramping up TTM inflation, is the president's decision to attack Iran. Shortly after these attacks began on Feb. 28, Iran announced the closure of the Strait of Hormuz to virtually all commercial vessels. This halted the daily movement of approximately 20 million barrels of petroleum liquids (about 20% of global demand) and represents the largest energy supply disruption in modern history.
⛽ Average U.S. gas prices per gallon on May 6, per AAA:
-- NBC News (@NBCNews) May 6, 2026
• Regular: $4.54 (⬆️ $1.56 since war in Iran began on Feb. 28)
• Premium: $5.39 (⬆️ $1.85 since war began)
• Diesel: $5.67 (⬆️ $1.81 since war began)
There was an immediate reaction in energy markets, with crude oil prices soaring. Consumers have witnessed gas prices rise at the fastest pace in over three decades.
However, this isn't the worst of it for the U.S. economy. The inflationary effects of energy supply shocks often lag for businesses by a couple of months. Once the effects of higher transportation and production costs are factored into monthly economic data, TTM inflation can head even higher.
The Federal Reserve Bank of Cleveland's Inflation Nowcasting tool, which updates as new economic data is reported to provide a current estimate for front-month inflation, is calling for TTM inflation to rise another 38 basis points to 4.18% in May. In other words, Trumpflation may not be as short-term as the president claims.

Image source: Getty Images.
Soaring inflation, a hawkish new Fed chair, and an expensive stock market are a dangerous combination
Soaring inflation is a significant worry for Wall Street because it could force the Federal Reserve to act.
May 15 marked the final day of Jerome Powell's second term as Fed chair. While Powell is staying on the Board of Governors, his departure paves the way for Trump's handpicked successor, Kevin Warsh, to take the lead. Warsh previously served on the FOMC -- the 12-person body, including the Fed chair, responsible for setting the nation's monetary policy -- from Feb. 24, 2006, to March 31, 2011.
But it's this past experience that should have investors rightfully worried about the future.
While guiding the U.S. economy through the financial crisis, Warsh's FOMC voting record shows he frequently cautioned against lower interest rates. He feared that lower rates would ignite inflation. Even as the unemployment rate jumped dramatically during the financial crisis, Warsh maintained his hawkish monetary approach.
If the leap is made that Warsh favors price stability above all else, entering his new leadership position with TTM inflation on course to top 4% in May (if not well beyond) is nightmare fuel for Wall Street.
"If Trump wants someone easy on inflation, he got the wrong guy in Kevin Warsh."@AnnaEconomist pic.twitter.com/FGMfeSqHpU
-- Daily Chartbook (@dailychartbook) January 31, 2026
According to the CME Group's FedWatch Tool, there's a progressively higher chance of a rate hike with each FOMC meeting over the next year. By April 2027, there's a greater-than-77% chance of the FOMC raising interest rates.
Higher rates can be a double-whammy for a historically pricey stock market. First, it makes borrowing costlier, which can slow the AI data center build-out that's fueled this bull market. Second, rate hikes should increase fixed-income yields, prompting some investors to opt for the safety of bonds instead of stocks.
History isn't on the side of Wall Street, either. The S&P 500's Shiller Price-to-Earnings Ratio recently topped 42, making this the second-priciest stock market in history, behind only the dot-com bubble. Including the present, the Shiller P/E has topped 30 just six times over 155 years, and the previous five occurrences were all followed by declines of 20% or greater in the Dow Jones Industrial Average, S&P 500, and/or Nasdaq Composite.
Trumpflation is roiling Wall Street, and it's unlikely to go away anytime soon.
Should you buy stock in S&P 500 Index right now?
Before you buy stock in S&P 500 Index, consider this:
The Motley Fool Stock Advisor analyst team just identified what they believe are the 10 best stocks for investors to buy now… and S&P 500 Index wasn’t one of them. The 10 stocks that made the cut could produce monster returns in the coming years.
Consider when Netflix made this list on December 17, 2004... if you invested $1,000 at the time of our recommendation, you’d have $477,813!* Or when Nvidia made this list on April 15, 2005... if you invested $1,000 at the time of our recommendation, you’d have $1,320,088!*
Now, it’s worth noting Stock Advisor’s total average return is 986% — a market-crushing outperformance compared to 208% for the S&P 500. Don't miss the latest top 10 list, available with Stock Advisor, and join an investing community built by individual investors for individual investors.
See the 10 stocks »
*Stock Advisor returns as of May 24, 2026.
Sean Williams has no position in any of the stocks mentioned. The Motley Fool has positions in and recommends CME Group. The Motley Fool has a disclosure policy.
Recommended Articles


