Hedera Price Forecast: HBAR bears test a crucial support, aiming for a 20% drop
- Hedera’s bearish reversal from a resistance trendline gains momentum, marking its fourth consecutive day of losses.
- Hedera futures fall as the funding rate turns negative, indicating a bearish shift in traders' sentiment.
- The Canary HBAR spot ETF recorded a $5.37 million net inflow on Thursday, coinciding with the launch of WBTC on Hedera.
Hedera (HBAR) price is down 4% at press time on Friday, piercing through a crucial support level at $0.1600, which risks a steeper 20% correction. Derivatives data signal a pessimistic shift among traders as HBAR futures Open Interest plummets and funding rates flip negative.
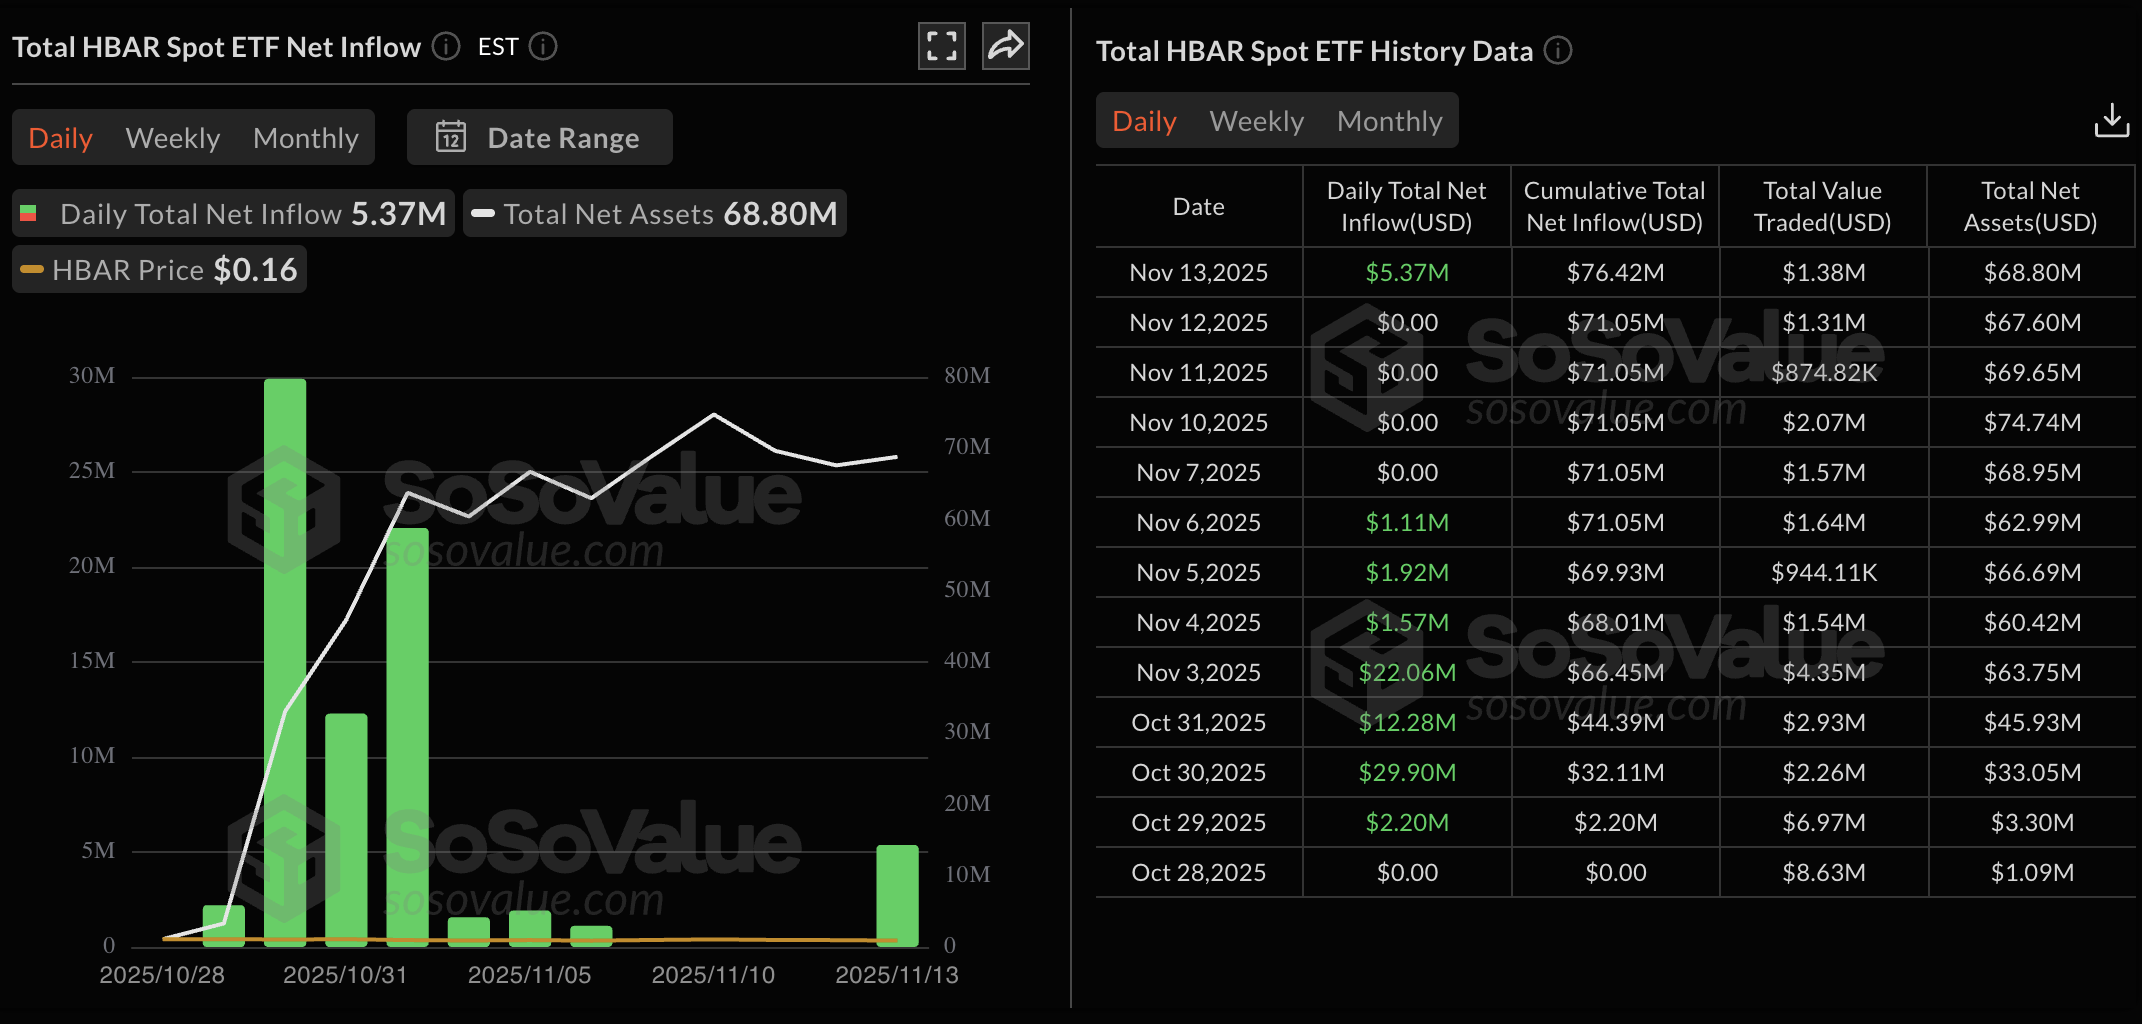
Despite the pullback, the Canary HBAR spot ETF recorded $5.37 million in net inflows on Thursday, coinciding with the launch of Wrapped Bitcoin (WBTC) on the Hedera blockchain.
Hedera ETF captures the dip amid WBTC integration
Hedera announced on Thursday the integration of Wrapped Bitcoin, in collaboration with BitGo and LayerZero, to add a new layer of liquidity on the network. Hedera’s fresh approach to liquidity, utilizing WBTC – a 1:1-backed tokenized Bitcoin on the Ethereum blockchain – rather than US Dollar-backed stablecoins, enhances BTC-powered decentralized finance (DeFi) services on the network.

Coinciding with the WBTC integration, institutional demand for HBAR spiked on Thursday as the Canary HBAR ETF logged an inflow of $5.37 million after four previous days of net zero flows. If the ETF continues to obtain steady inflows, it could boost retail sentiment while absorbing and reducing supply pressure.

Bears tighten grip over HBAR derivatives
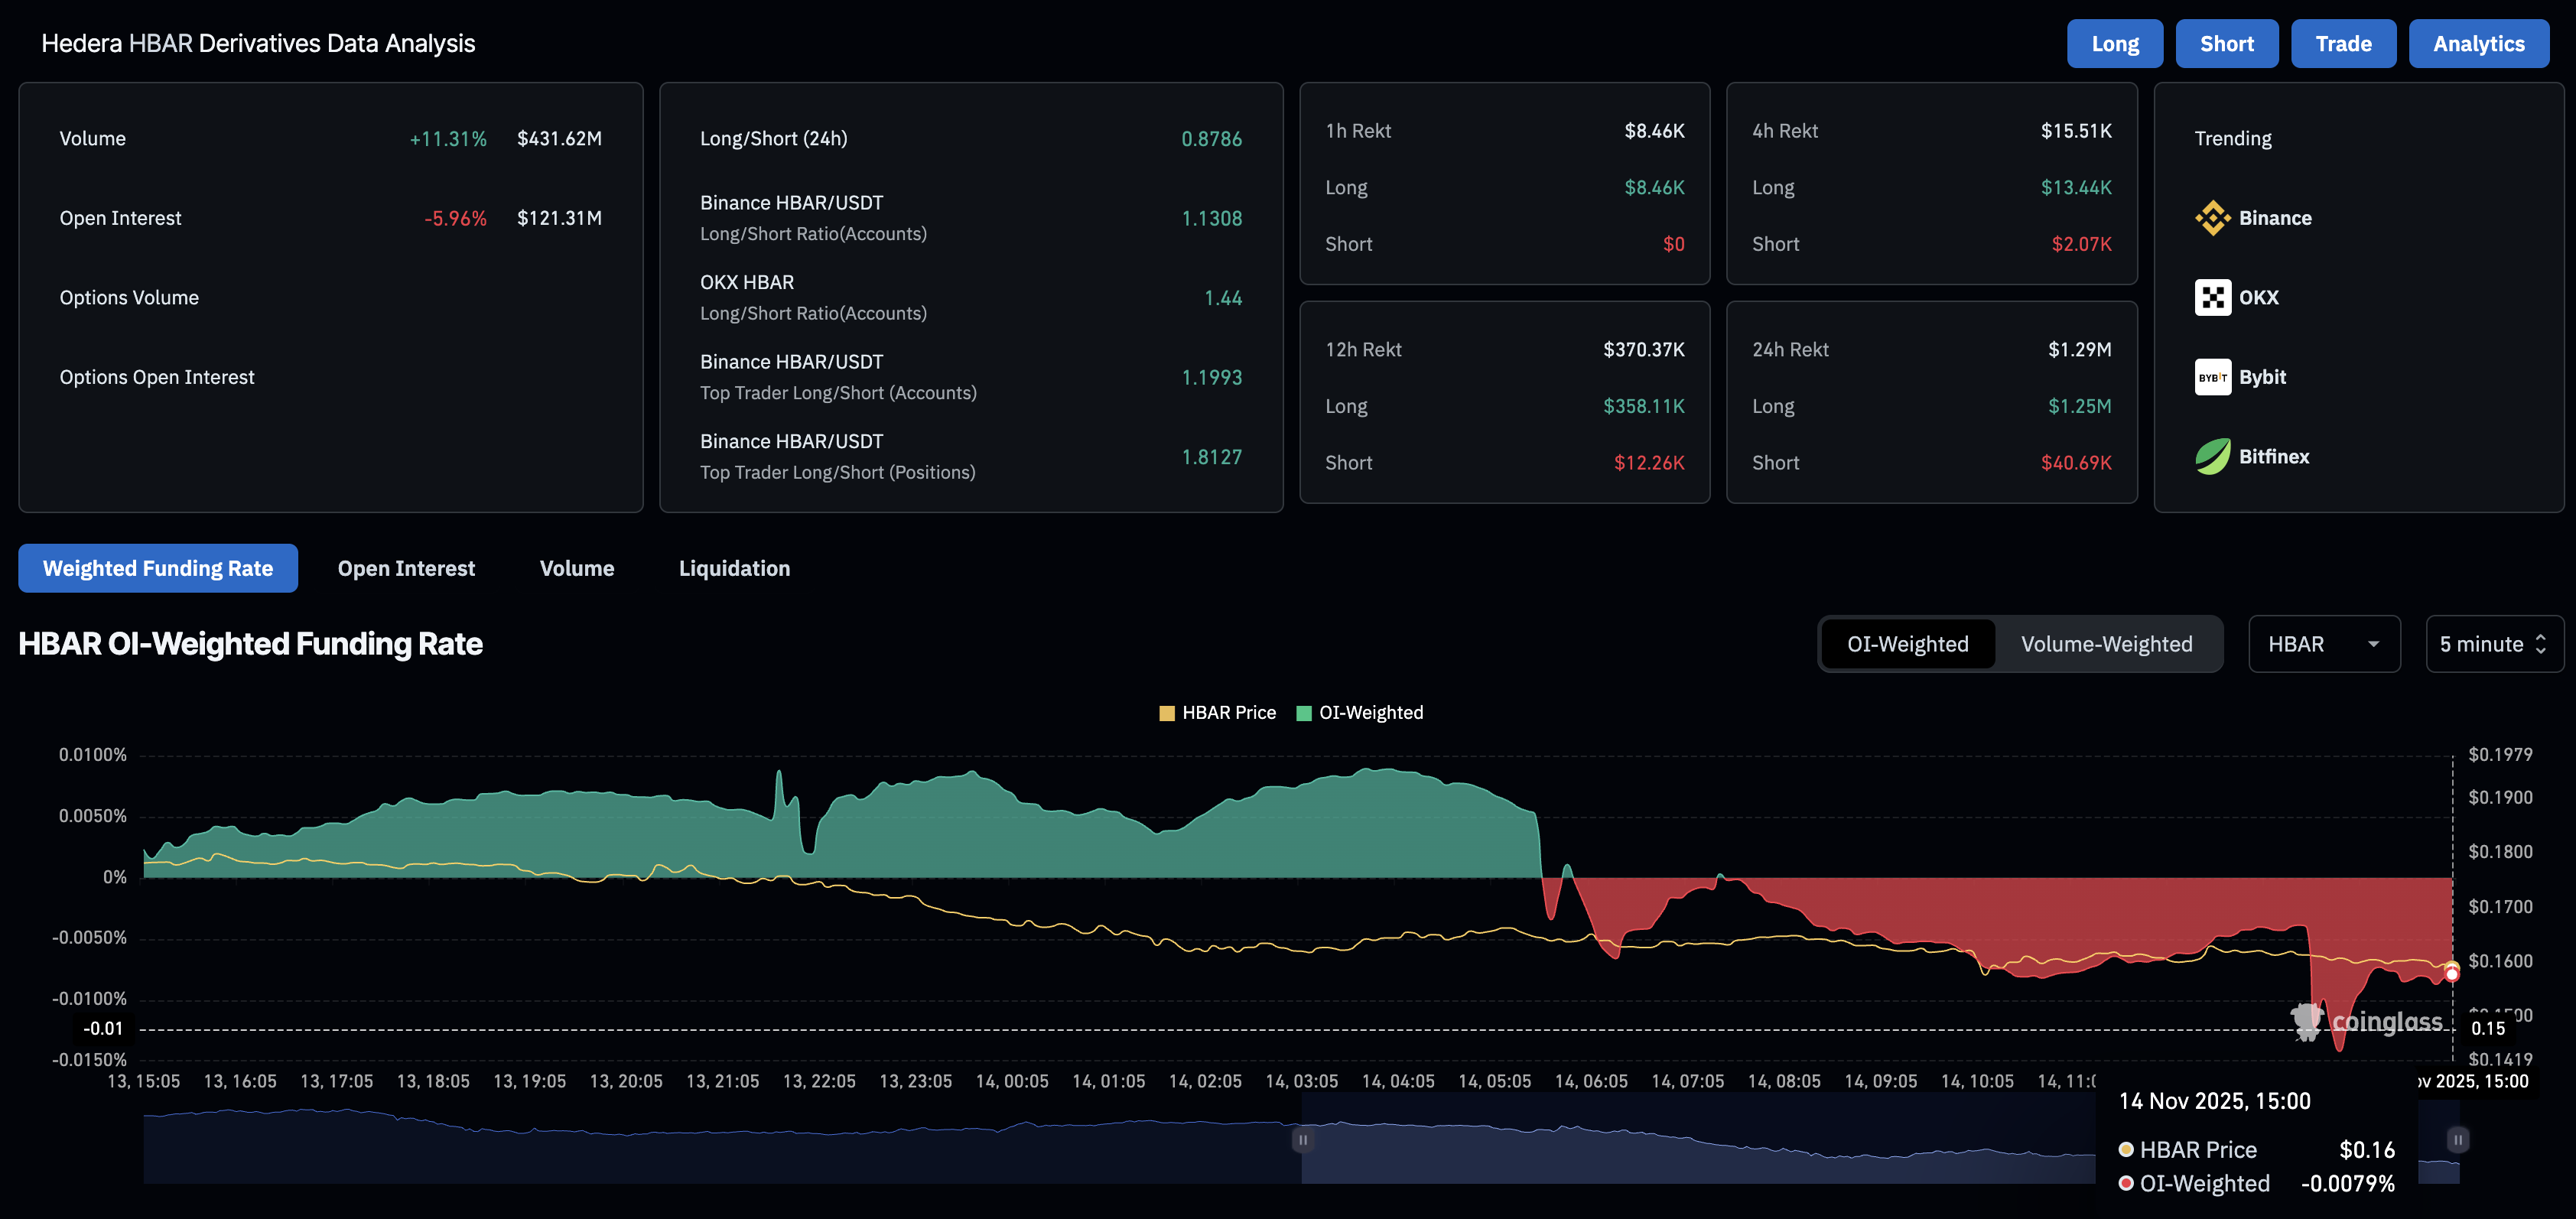
Despite the WBTC integration and ETF inflows, Hedera struggles to retain retail interest. CoinGlass data shows that the HBAR futures Open Interest (OI) is at $121.31 million on Friday, recording a 5.96% fall in the last 24 hours. A drop in OI value indicates a decline in the notional value of futures contracts as traders reduce the leverage or close positions.
Corroborating the risk-averse sentiment, the OI-weighted funding rate is now at -0.0079%, having flipped negative from 0.0089% earlier in the day, as bears pay a premium to hold short positions.

Will Hedera break below $0.1600 support level?
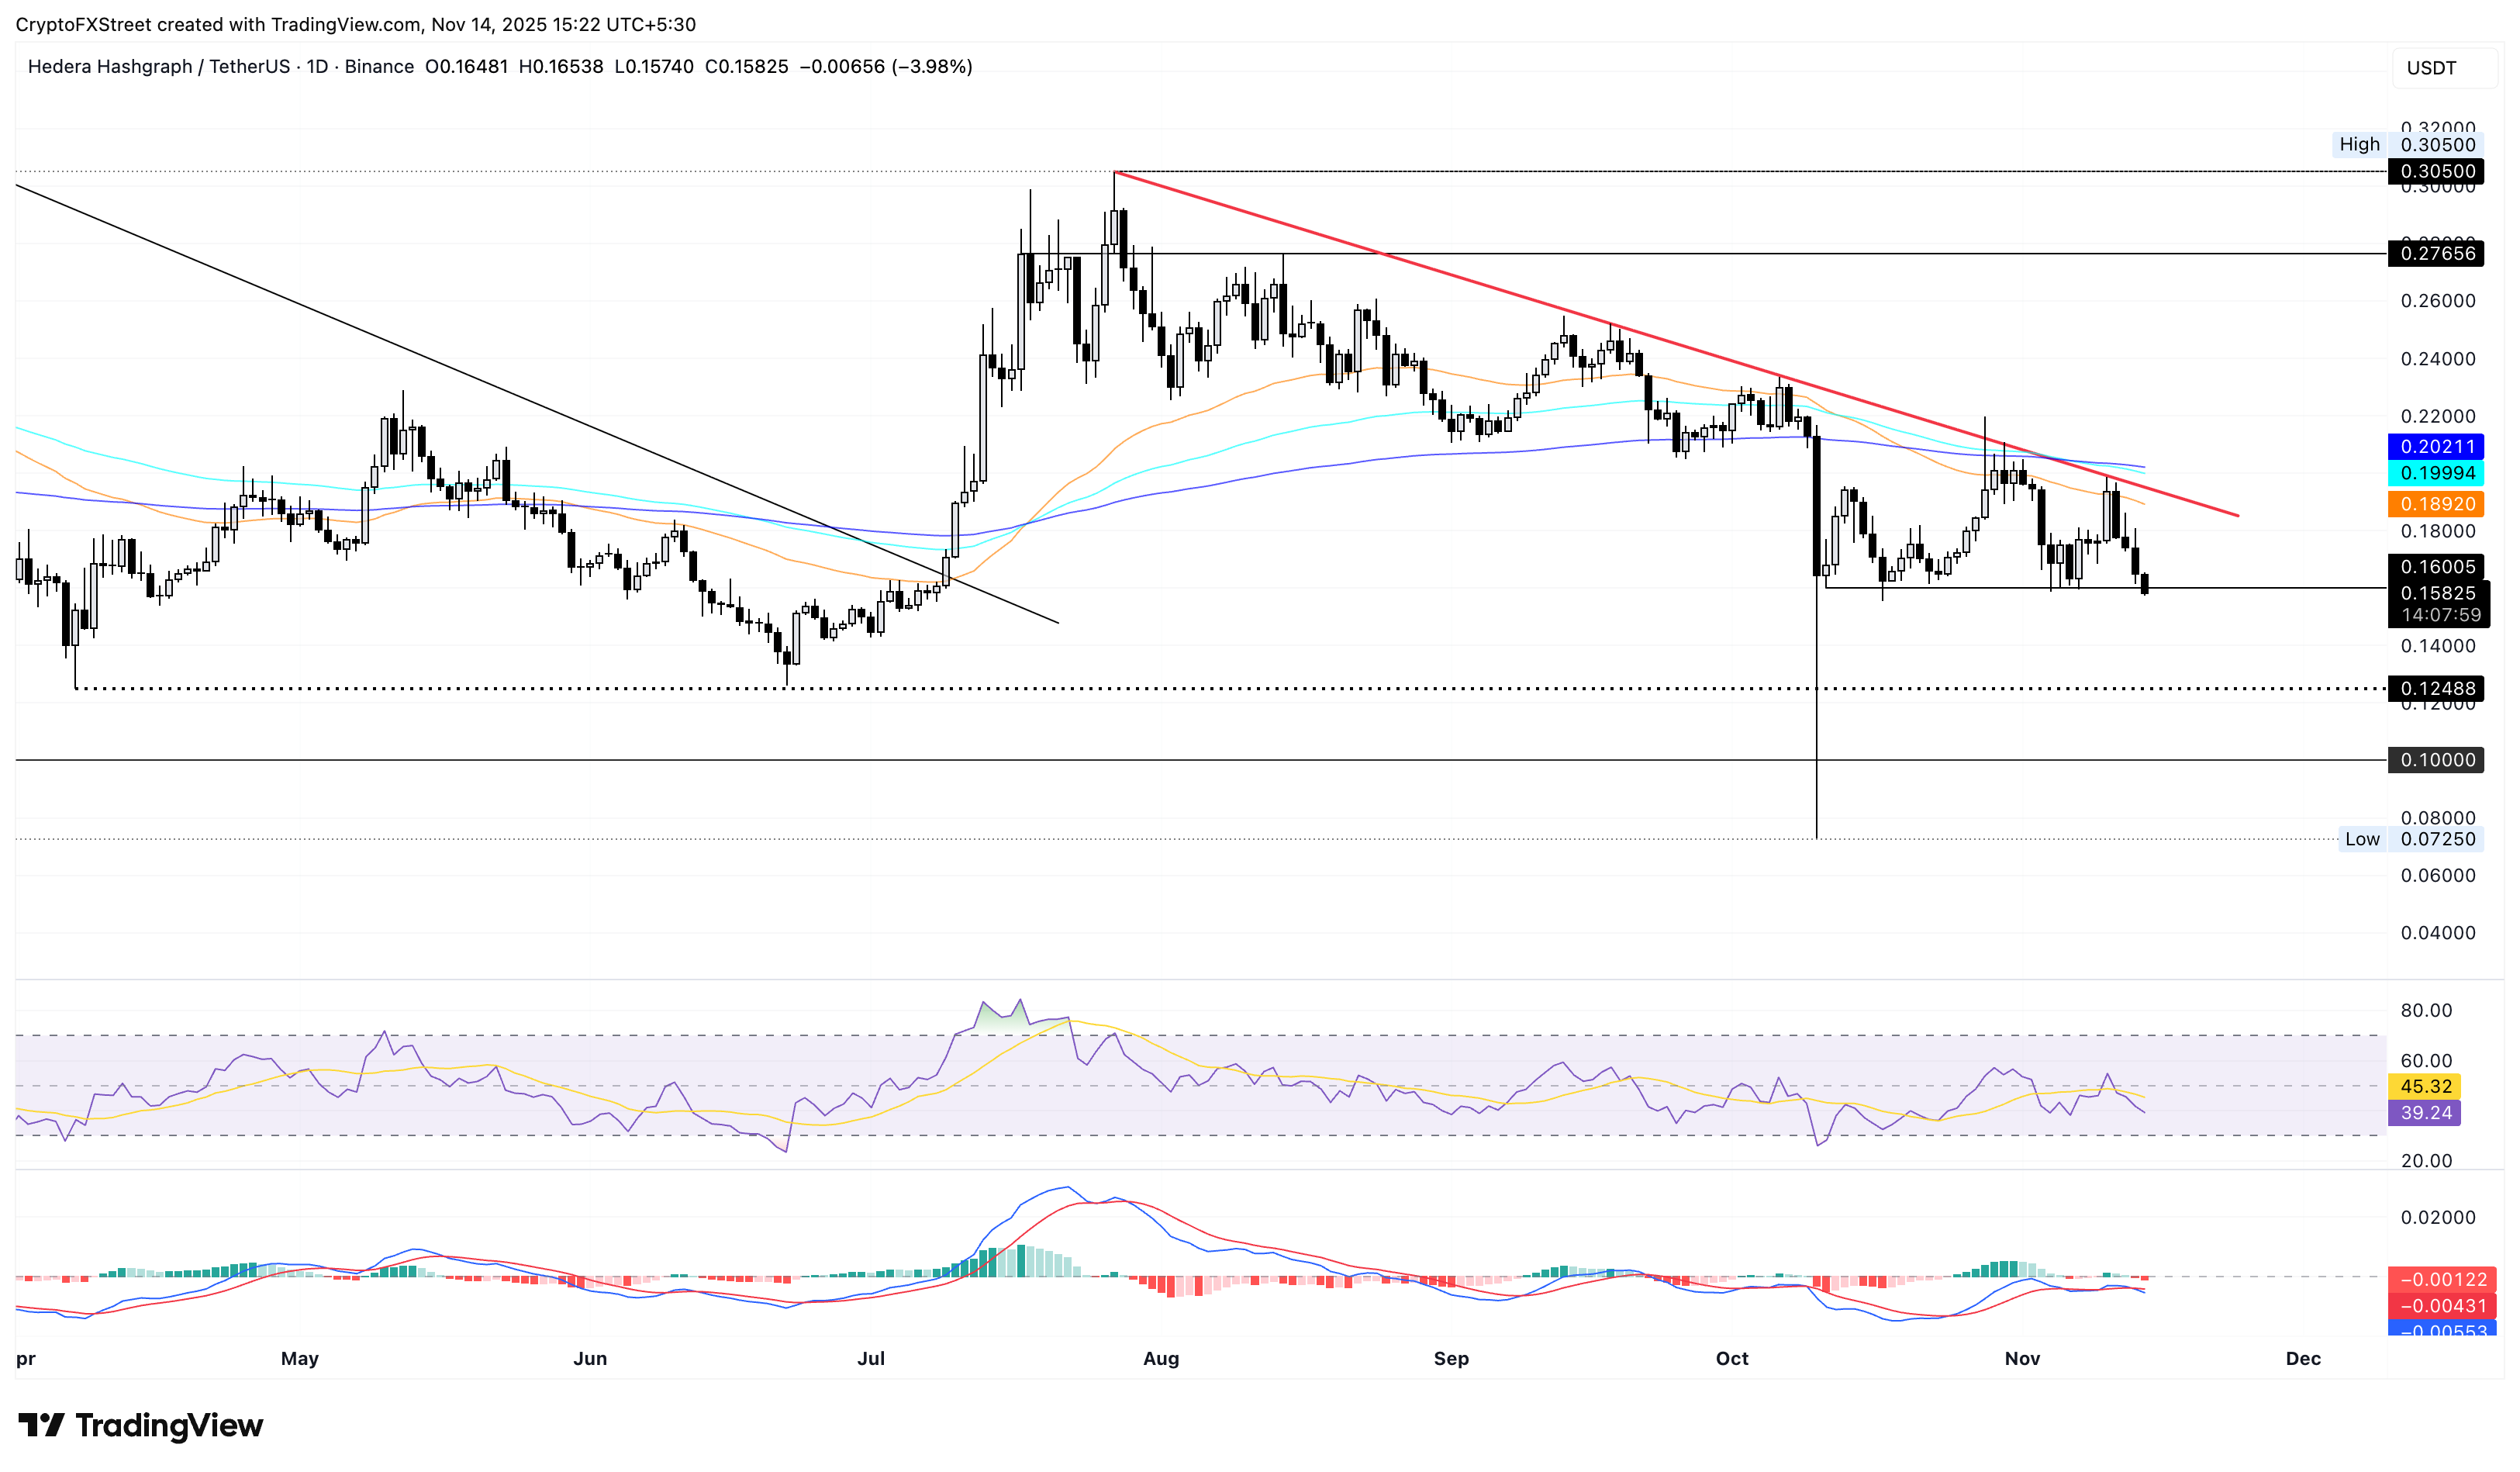
Hedera is down 10% so far this week, after reversing from a resistance trendline formed by connecting the July 27 and September 18 peaks, on Tuesday. The open-source blockchain token risks a daily close below the $0.1600 support level, which has provided three bounce-backs since early October.
If HBAR fails to hold above $0.1600 by the end of the day, it could further extend the pullback to the April 7 low at $0.1248, resulting in nearly a 20% decline from the current market price.
The Relative Strength Index (RSI) at 39 slips to the downside on the daily chart, aiming for the oversold zone with further room for correction. Additionally, the Moving Average Convergence Divergence (MACD) on the same time frame flashes a sell signal as it crosses below the red line.

Looking up, a potential rebound in HBAR from $0.1600 could test the 50-day Exponential Moving Average (EMA) at $0.1892.


