

NVIDIA Corp Stock (NVDA) Moved Down by 3.46% on Jun 9: Drivers Behind the Movement
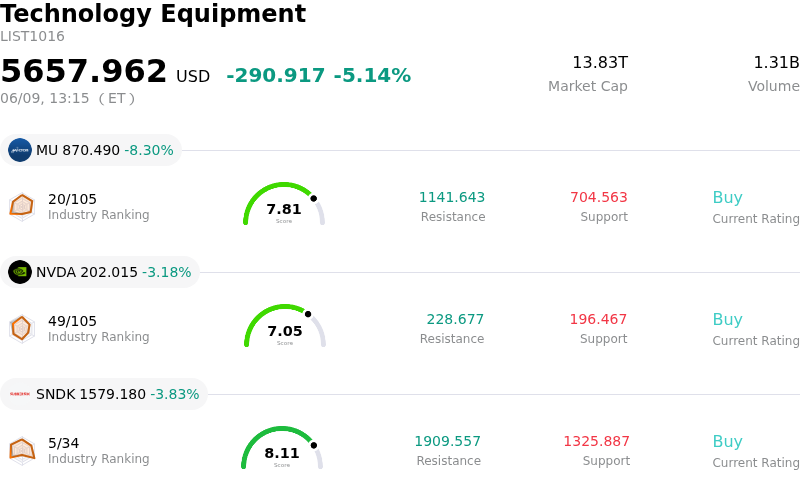
NVIDIA Corp (NVDA) moved down by 3.46%. The Technology Equipment sector is down by 5.14%. The company outperformed the industry. Top 3 stocks by turnover in the sector: Micron Technology Inc (MU) down 8.30%; NVIDIA Corp (NVDA) down 3.46%; SanDisk Corporation (SNDK) down 3.83%.
What is driving NVIDIA Corp (NVDA)’s stock price down today?
The decline in NVDA's share price reflects a continuation of caution within the broader technology and semiconductor sectors, influenced by recent macroeconomic signals and specific company-related developments. Investor sentiment has been impacted by concerns regarding the trajectory of interest rates, following stronger-than-expected employment data that suggests the Federal Reserve may maintain a restrictive monetary policy stance for an extended period. This broader market headwind tends to weigh particularly on growth stocks with higher valuations.
Adding to the sector's pressure in recent trading sessions was a cautious outlook from a peer in the artificial intelligence chip market. Although that company reported strong financial results, its guidance for future chip sales did not meet elevated analyst expectations, prompting a reassessment of valuations across the industry. This event likely contributed to profit-taking and amplified sensitivity to market risks, affecting leading companies like NVDA.
Furthermore, NVDA's stock has faced specific scrutiny following an analyst downgrade earlier in the week. This adjustment reflected concerns that previous rapid price appreciation had exhausted short-term upside potential, with market expectations already at very high levels. The analyst also cited potential delays in data center infrastructure buildouts, which could challenge consensus earnings growth forecasts for future fiscal years, thereby questioning current valuation assumptions. Persistent concerns about increasing competition in the AI chip market, including custom silicon development by major technology firms, also contribute to a cautious outlook among some investors.
Technical Analysis of NVIDIA Corp (NVDA)
Technically, NVIDIA Corp (NVDA) shows a MACD (12,26,9) value of [3.72], indicating a neutral signal. The RSI at 46.71 suggests neutral condition and the Williams %R at -84.58 suggests oversold condition. Please monitor closely.
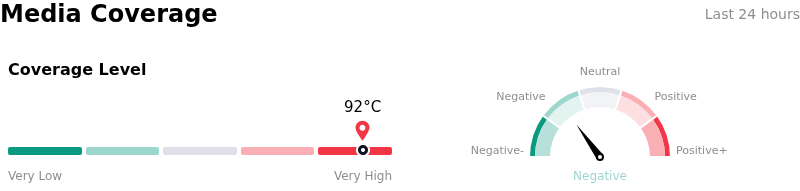
Media Coverage of NVIDIA Corp (NVDA)
In terms of media coverage, NVIDIA Corp (NVDA) shows a coverage score of 92, indicating a very high level of media attention. The overall market sentiment index is currently in bearish zone.
Fundamental Analysis of NVIDIA Corp (NVDA)
NVIDIA Corp (NVDA) is in the Technology Equipment industry. Its latest annual revenue is $215.94B, ranking 1 in the industry. The net profit is $120.07B, ranking 1 in the industry. Company Profile
Over the past month, multiple analysts have rated the company as Buy, with an average price target of $295.22, a high of $500.00, and a low of $180.00.
More details about NVIDIA Corp (NVDA)
Company Specific Risks:
- An analyst downgrade to 'Hold' reflects concerns that rapid price appreciation has exhausted and market expectations for future growth are overly elevated, despite strong reported earnings.
- Potential widespread delays in US data center buildouts threaten consensus earnings growth forecasts for fiscal years 2027 and 2028, creating a bottleneck for customer chip delivery.
- Increased competition from in-house chip development by hyperscalers (e.g., Amazon, Microsoft) and signals from peers like Broadcom about customers potentially diversifying chip suppliers indicate a risk to NVIDIA's customer concentration.
- Elevated geopolitical risk stems from increased US regulatory scrutiny regarding AI chip exports to China, amplified by an impending Senate hearing on compliance that CEO Jensen Huang has reportedly declined to attend.
Recommended Articles


