



Dogecoin Price Forecast: Bullish divergence hints at DOGE recovery

Source Fxstreet
  • Dogecoin steadies at $0.070 on Tuesday after correcting 3.5% in the previous week.
  • Derivatives metrics support a recovery, with long bets reaching the monthly high and positive funding rates.
  • The technical outlook shows a bullish divergence, suggesting bearish momentum may be losing strength.

Dogecoin (DOGE) steadies near $0.070 at the time of writing on Tuesday after falling 3.5% last week. While the broader trend remains bearish, improving derivatives metrics and bullish divergences in momentum indicators suggest that selling pressure may be easing, hinting at a potential recovery.

Derivatives metrics support a bullish bias

Derivatives data shows bullish sentiment among Dogecoin traders. CoinGlass’ long-to-short ratio for memecoin reads 1.25 on Tuesday, the highest level over a month. A ratio above one indicates bullish sentiment, as traders are betting the asset price will rise.
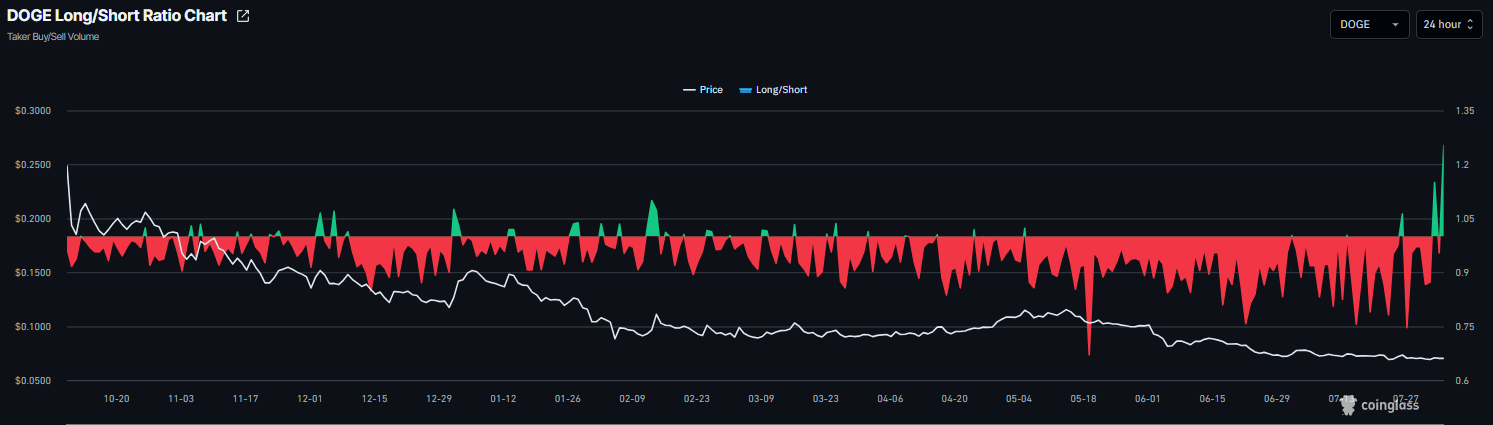
DOGE long-to-short chart. Source: Coinglass

In addition, CoinGlass’ funding rates metric for Dogecoin flipped positive on July 24, reading 0.0074% on Tuesday. These positive rates indicate that long traders are paying shorts and reflect a bullish bias for the dog-themed meme coin.
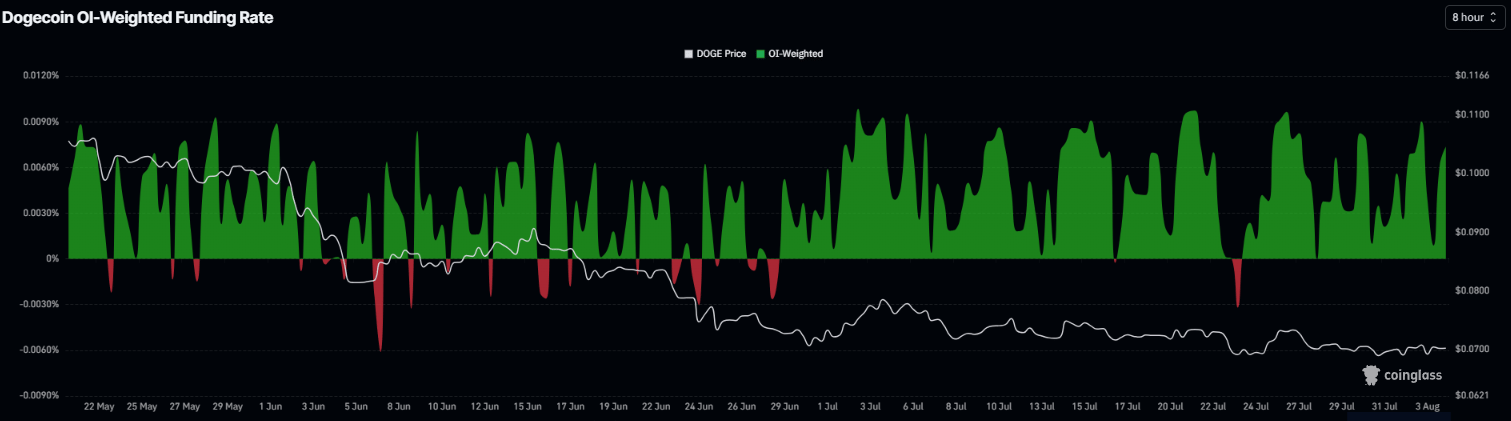
Dogecoin funding rates chart. Source: Coinglass

Dogecoin technical outlook: Bullish divergence in momentum indicators 

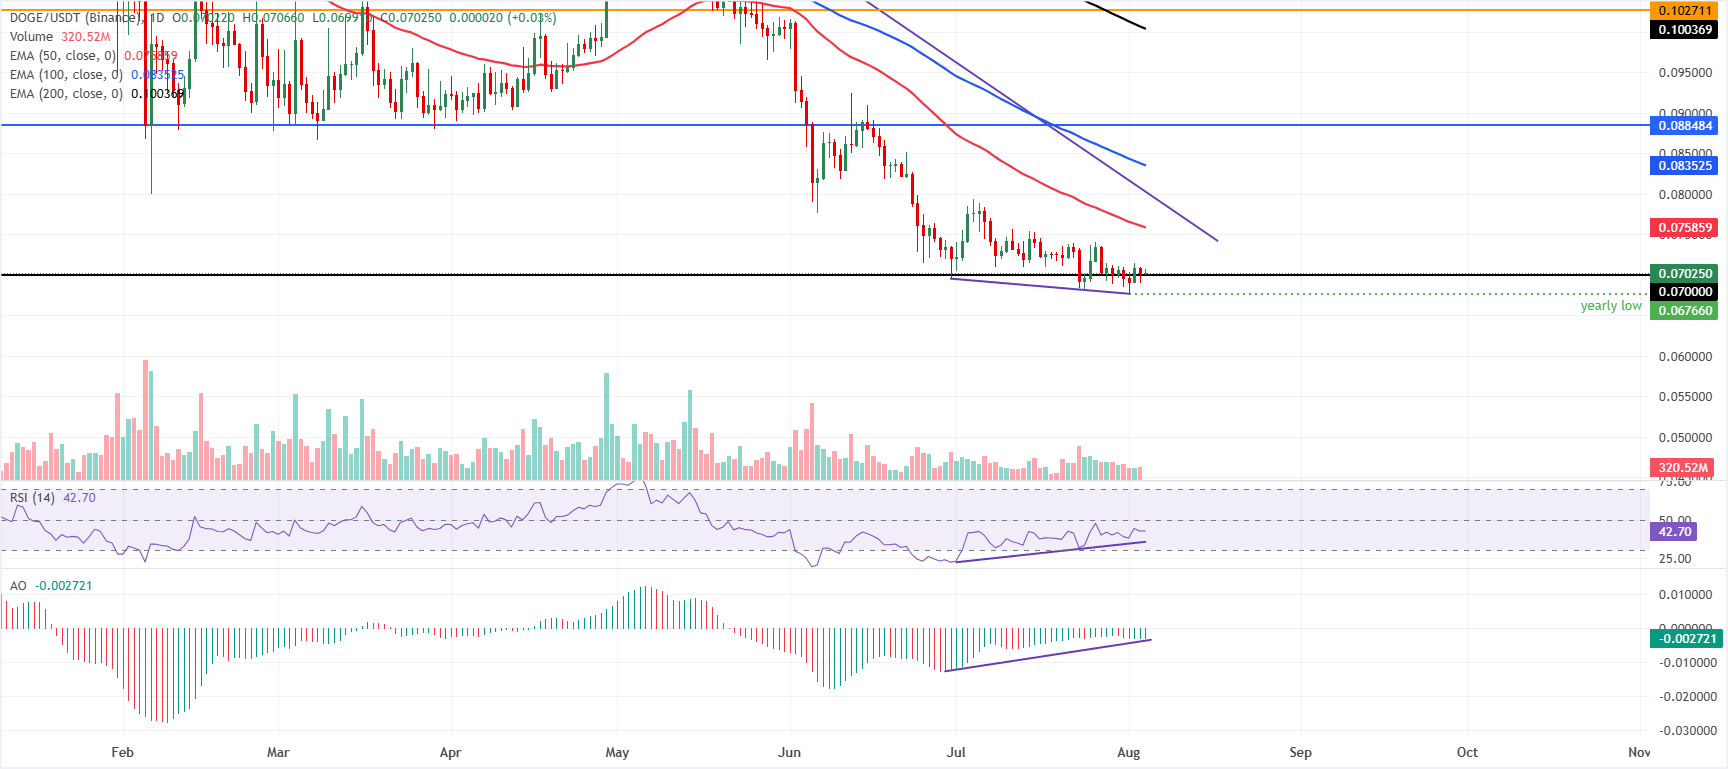
Dogecoin trades at $0.070 on Tuesday, maintaining a bearish near-term bias as price holds below the 50-day, 100-day, and 200-day Exponential Moving Averages (EMAs) at $0.075, $0.083, and $0.100, respectively. 

Momentum indicators show a bullish divergence in the Relative Strength Index (RSI) on the daily chart, as DOGE price formed a lower low on August 1 while the RSI registered a higher low, suggesting that bearish momentum is weakening. The Awesome Oscillator (AO) supports this divergence as its recent lows are rising while price remains near its lows, indicating that downside momentum is fading.

On the downside, immediate support is seen at the horizontal level of $0.070, with next support at the yearly low at $0.067; a close below it suggests deeper losses toward the key psychological level of $0.065. 

On the topside, initial resistance is defined by the 50-day EMA at $0.075, followed by the descending trendline break region near $0.080 and the 100-day EMA at $0.083; a stronger barrier is found at the $0.088 horizontal resistance, ahead of the 200-day EMA at $0.100 and the key horizontal cap at $0.102, levels that would need to be reclaimed to ease the prevailing bearish tone.
(The technical analysis of this story was written with the help of an AI tool. Know more.)

Disclaimer: For information purposes only. Past performance is not indicative of future results.
placeholder
USD/JPY Forecast: Yen Strength Puts 152 Support in Focus as BoJ Tightening LoomsUSD/JPY remains under pressure as the Japanese yen strengthens ahead of another potentially important Bank of Japan policy decision. The pair has fallen toward the mid-155 region after breaking below
Author  Beincrypto
Sept 22, Tue
USD/JPY remains under pressure as the Japanese yen strengthens ahead of another potentially important Bank of Japan policy decision. The pair has fallen toward the mid-155 region after breaking below
placeholder
Temasek CIO Is Watching Two Risks to Global Markets in 2027, and AI Tops the ListTemasek’s investment chief called an artificial intelligence (AI) trade unwind the biggest risk facing global markets. Yet, the firm still plans to more than double its AI allocation by 2031.Rohit Sip
Author  Beincrypto
Oct 08, Thu
Temasek’s investment chief called an artificial intelligence (AI) trade unwind the biggest risk facing global markets. Yet, the firm still plans to more than double its AI allocation by 2031.Rohit Sip
placeholder
Bitcoin Returns to ETF Holders’ Breakeven Price, and $729 Million Heads for the ExitUS spot Bitcoin (BTC) exchange-traded fund (ETF) investors pulled $729 million over two sessions this week. The selling hit just as BTC returned to the funds’ estimated average entry price, suggesting
Author  Beincrypto
Yesterday 01: 53
US spot Bitcoin (BTC) exchange-traded fund (ETF) investors pulled $729 million over two sessions this week. The selling hit just as BTC returned to the funds’ estimated average entry price, suggesting
placeholder
Bitcoin Price Flashes a Hidden Uptrend Signal Amid One 96% ProblemBitcoin (BTC) price trades near $82,300, still up about 28% over three months after this week’s drop.A hidden momentum signal on the daily chart suggests the uptrend can survive. The catch is that buy
Author  Beincrypto
Yesterday 01: 54
Bitcoin (BTC) price trades near $82,300, still up about 28% over three months after this week’s drop.A hidden momentum signal on the daily chart suggests the uptrend can survive. The catch is that buy
placeholder
1 in 5 US Tax Dollars Are Now Funding Interest and Yields Keep RisingMore than 1 in 5 US tax dollars now goes to interest on the national debt, while the 10-year Treasury yield sits near a 24-year high. That surge has yet to fully reach the federal budget.The Congressi
Author  Beincrypto
Yesterday 01: 58
More than 1 in 5 US tax dollars now goes to interest on the national debt, while the 10-year Treasury yield sits near a 24-year high. That surge has yet to fully reach the federal budget.The Congressi
Related Instrument
goTop
quote