
Ethereum Price Forecast: ETH on-chain data shows bullish signs as Fed cut rates
Ethereum price today: $4,530
- Ethereum whales have accumulated over 1 million ETH since the beginning of September.
- Weekly selling pressure has also contracted considerably, declining from 1.8 million ETH on August 15 to 783K ETH.
- ETH bulls and bears continue to battle at the 20-day SMA support and $4,500 resistance.
Ethereum (ETH) on-chain data shows bullish signs as the Federal Reserve (Fed) reduced its interest rate by a quarter percentage point on Wednesday.
Is Ethereum on track for an uptrend after Fed's 25 basis points rate cut?
Ethereum investors may be leaning toward a potential uptrend with the resumption of a Fed pivot, following rising whale demand, low selling pressure, network activity recovery, and an increasing stablecoin supply, according to CryptoQuant data.
Investors with a balance of 10K-100K ETH, also known as whales, have accumulated 1 million ETH and pushed their collective holdings to 21.39 million ETH since the beginning of September. The expansion in whale holdings coincides with a modest distribution from small-scale investors.
-1758140262980-1758140262981.png)
ETH Balance by Holder Value. Source: CryptoQuant
During the same period, accumulation addresses or wallets with no record of selling activity saw inflows of 4.1 million ETH. In just half the time, these addresses, often dominated by new wallets, have acquired nearly the total 4.5 million ETH inflows that accumulation addresses saw in August — a record figure for Ethereum.
While demand builds, selling activity has decreased considerably, with the 7-day moving average of ETH inflows to exchanges dropping from 1.8 million ETH on August 15 to 783K ETH, its lowest level since July, CryptoQuant noted in a Wednesday report.
 - All Exchanges (1)-1758140323196-1758140323196.png)
ETH Exchange Inflows. Source: CryptoQuant
At the same time, USDT supply on Ethereum has grown by $11 billion since mid-August, indicating expansion of 'dry powder' amid the Fed's reduced rate decision.
Meanwhile, Ethereum network activity has also picked up pace in September, with active addresses and transaction count resuming an uptrend after declining in mid-August.
Despite the growth in key on-chain data, Ethereum has been range-bound over the past three weeks, aligning with the historical crypto market lull between August and September.
With a rate cut confirmed, it's unclear if the Fed's decision could supercharge these on-chain metrics to spur risk-on sentiment or trigger a sell-the-news event.
Ethereum Price Forecast: ETH bulls and bears battle at 20-day SMA and $4,500 resistance
Ethereum experienced $95.4 million in futures liquidations over the past 24 hours, comprising $67.9 million and $27.5 million, respectively, per Coinglass data.
ETH is retesting the 20-day Simple Moving Average (SMA) after seeing a rejection just above the $4,500 level on Wednesday. If ETH loses the 20-day SMA, it could find support at the 50-day SMA near the $4,300-$4,400 range, where investors purchased about 1.7 million ETH in the past few weeks. The $4,000 psychological level could also serve as a key support if ETH extends the decline.
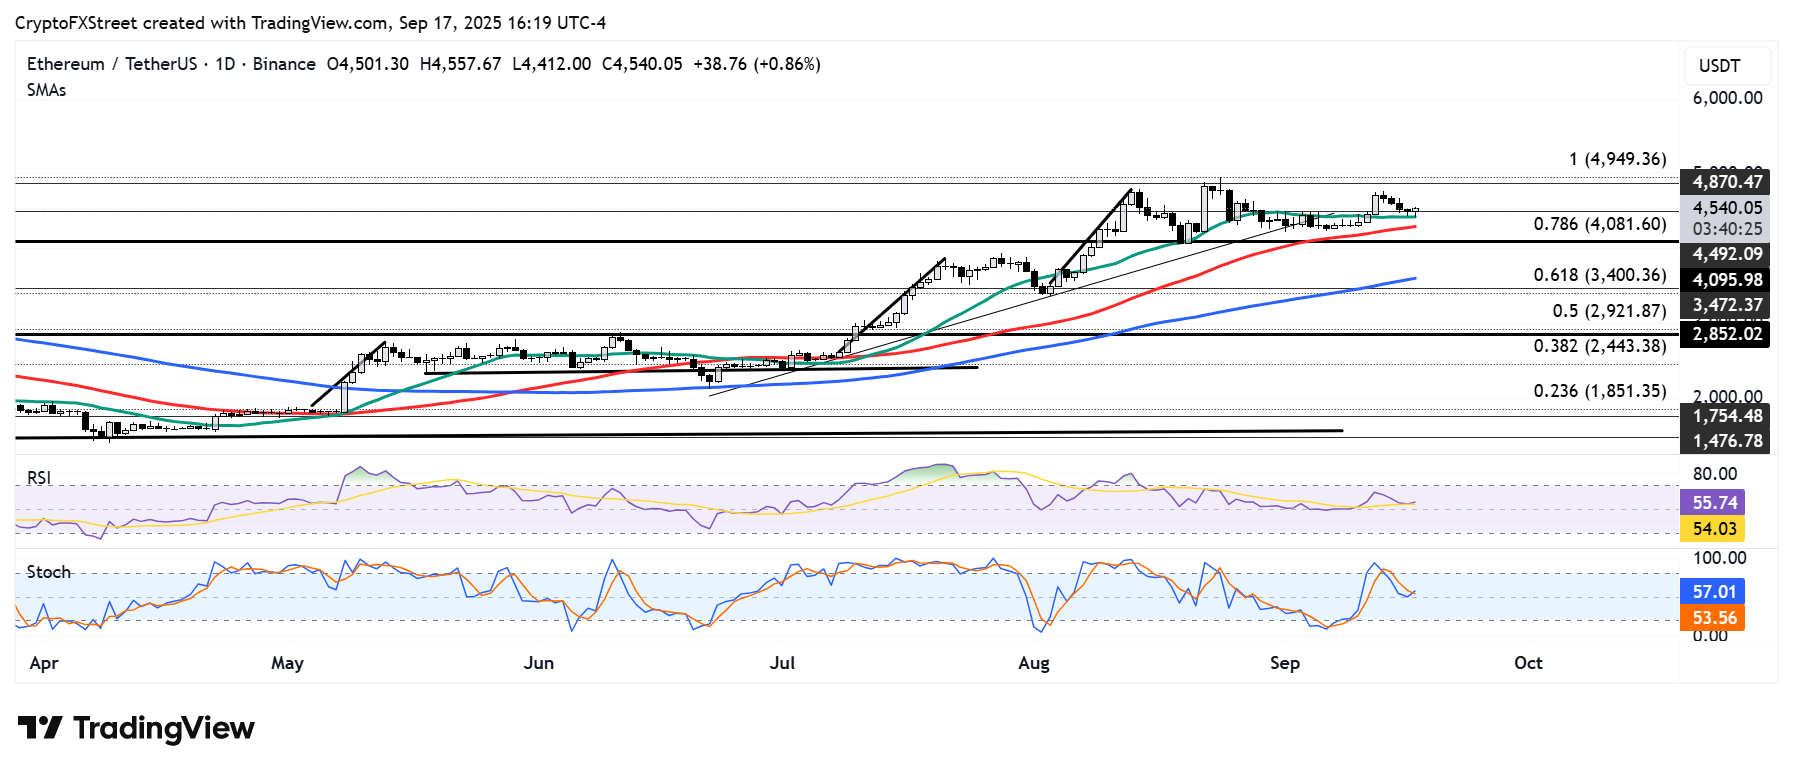
ETH/USDT daily chart
The Relative Strength Index (RSI) has crossed below its moving average yellow line and is testing its neutral level, while the Stochastic Oscillator (Stoch) has breached its midline. A further decline in the RSI below its midline will accelerate bearish momentum.
Recommended Articles


